Reference: A.U. Abeysekara et al. (The VERITAS Collaboration), Astrophysical Journal 894: 51, 2020
Full text version
ArXiv: ArXiV:2003.13615
Contacts: Sajan Kumar, Alina Wilhelm
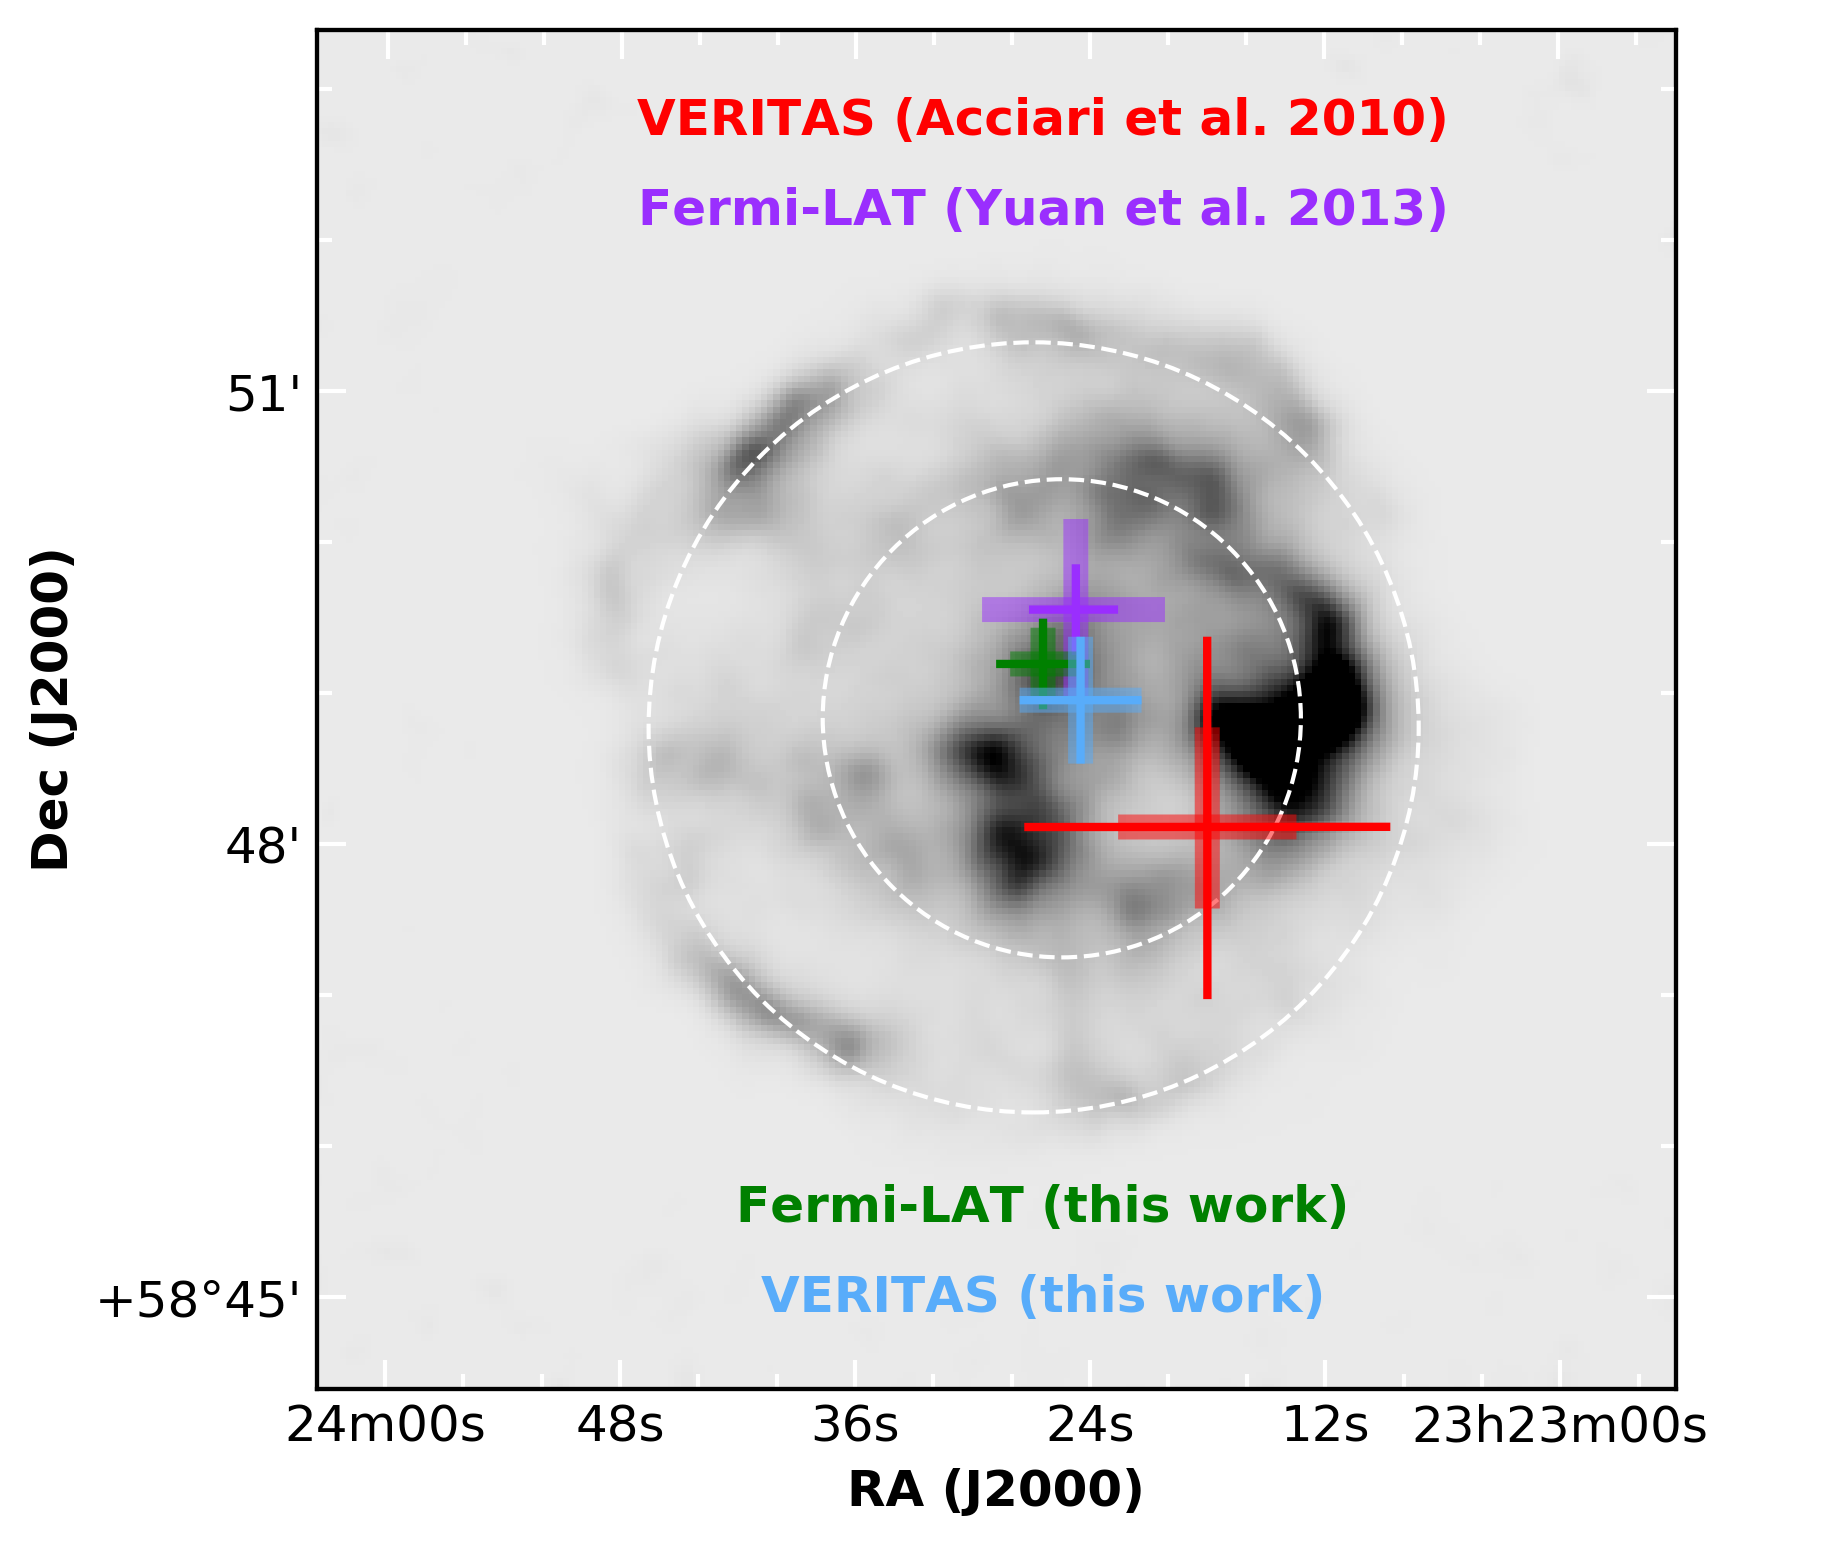
Cassiopeia A (Cas A) is one the youngest supernova remnants (SNR) ( ~350 years old) in our galaxy, providing the ideal case to test the hypothesis of SNRs as the most promising sites for the acceleration of Galactic cosmic rays up to PeV (1015 eV) energies. The progenitor of Cas A is believed to have been a red supergiant, which lost most of its hydrogen envelope through strong stellar winds before the supernova occurred. The distance to this SNR is estimated to be 3.4+0.3-0.1 kpc, which leads to a physical size of the remnant of 5 pc in diameter. Of the few historic Galactic SNRs, it has been observed extensively over a broad spectral range from radio through X-ray, and up to γ-ray wavelengths.
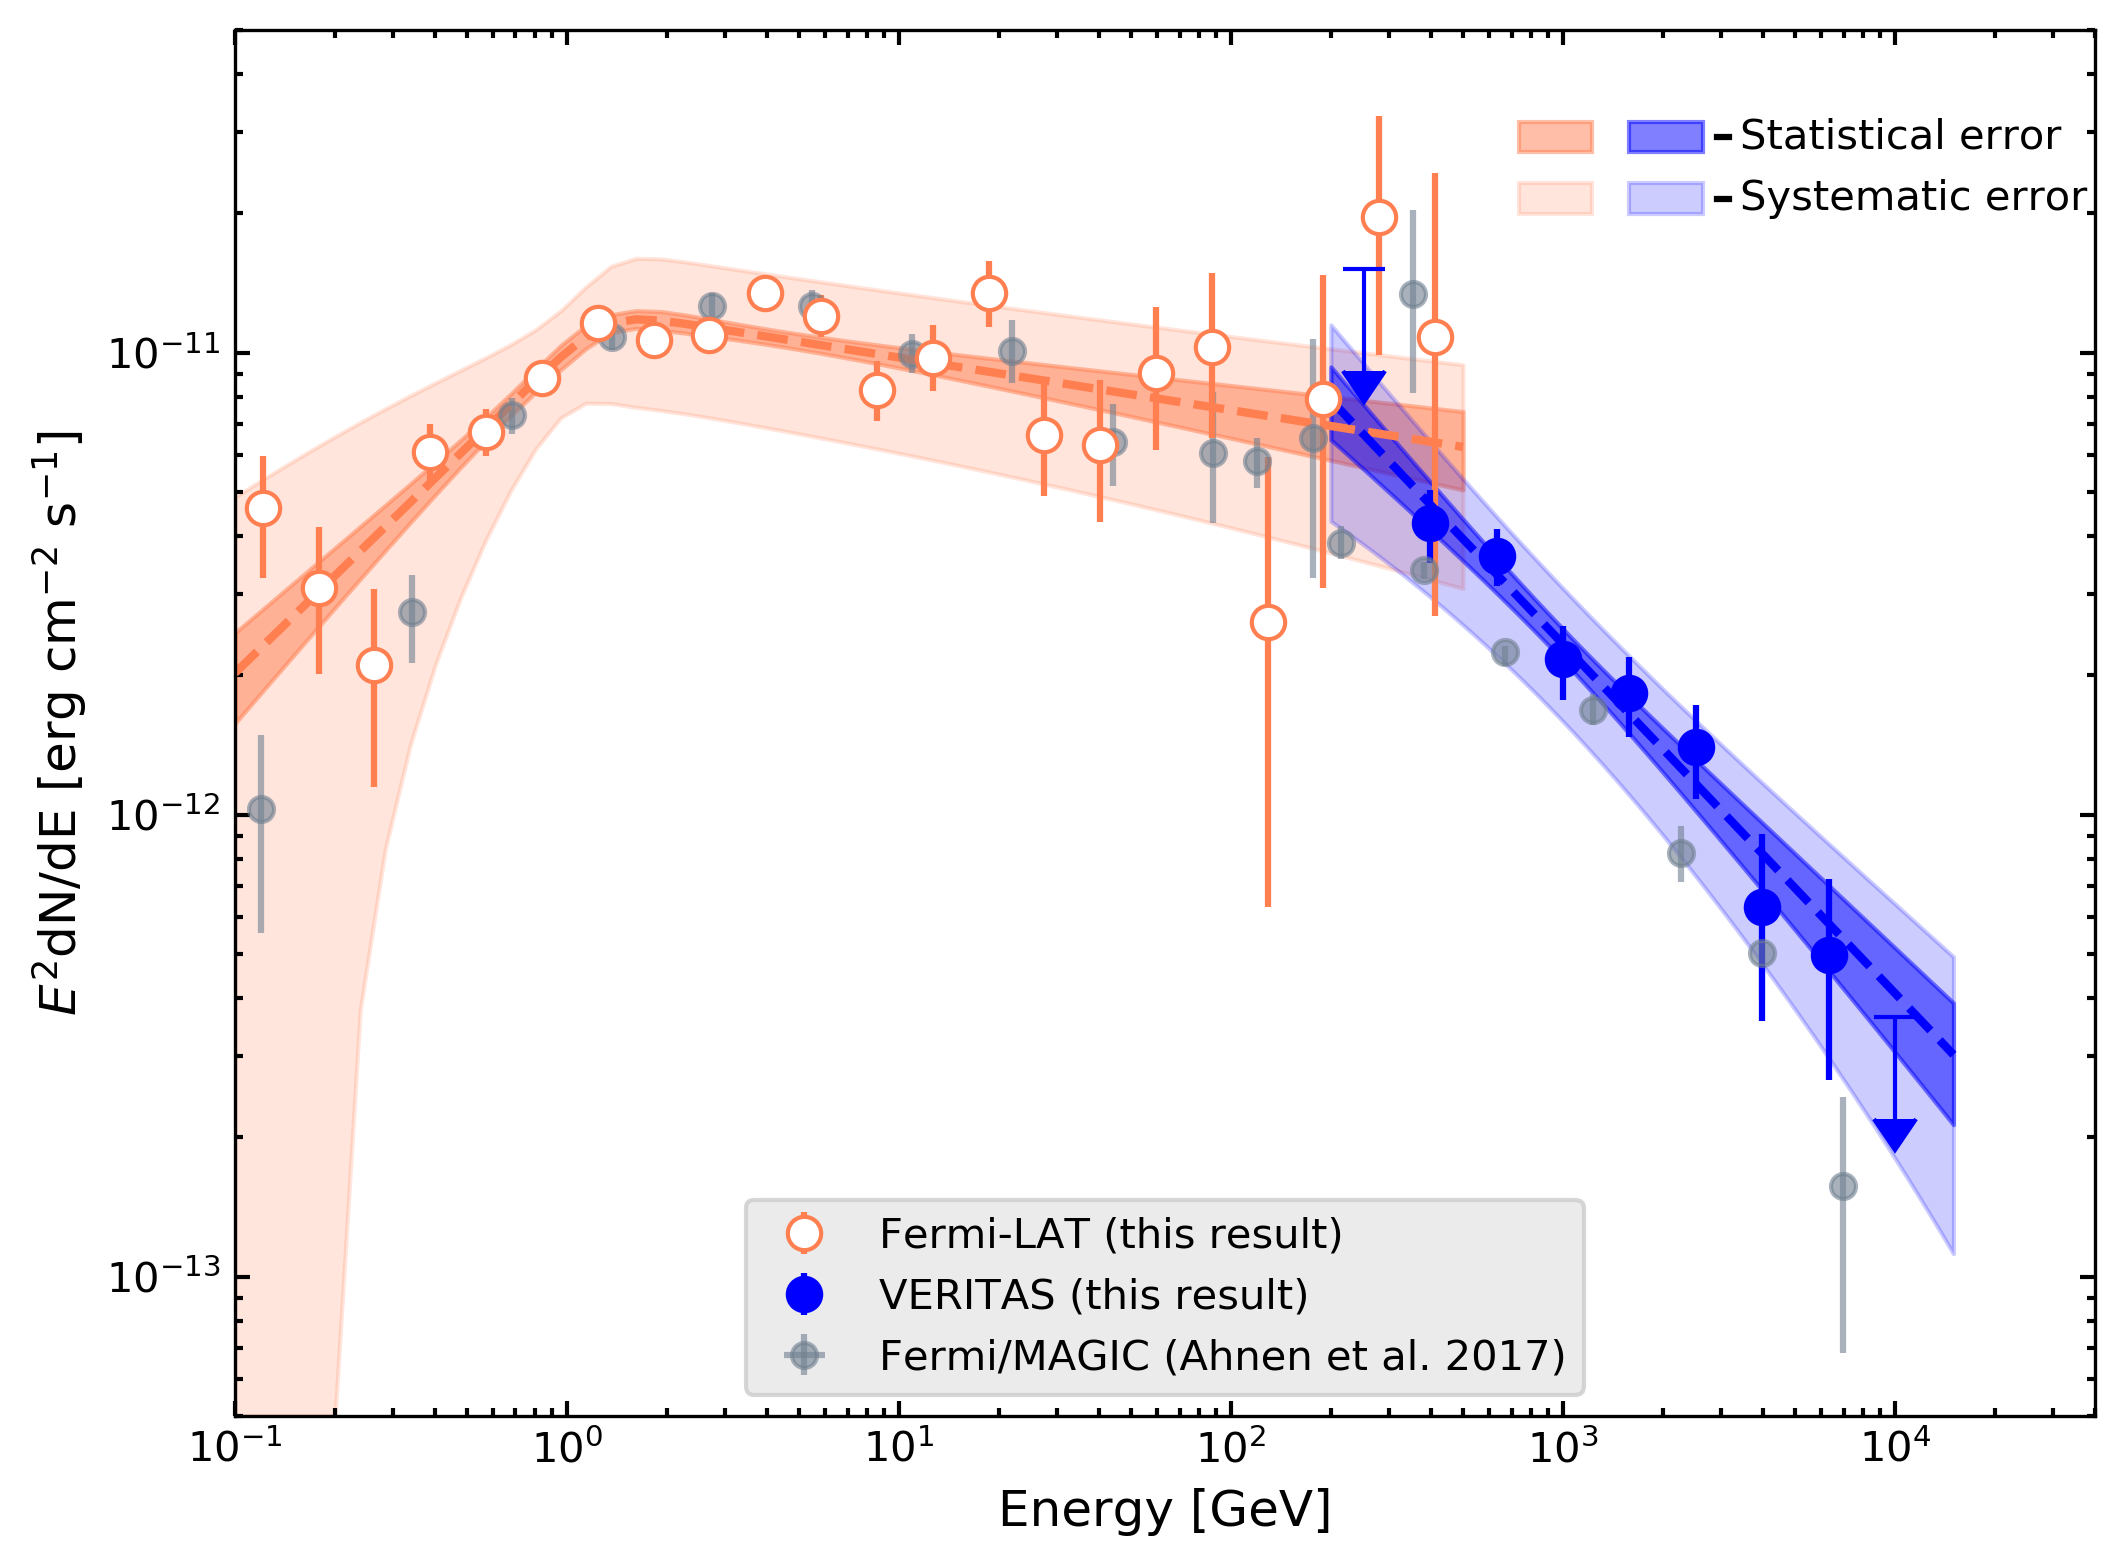
VERITAS observed Cas A from 2007 until 2012, which after quality cuts, gives about 65 hours of good data. To increase the eff ective collection area of the VERITAS array for the highest-energy gamma rays, ~23 hours of data out of the total 65 hours is taken at large zenith angles ( >55 deg). Additionally, we also analyzed 10.8 years of Fermi Pass 8 R3 LAT data, from 2008 August 4 to 2019 May 31. This helps us to perform a broad band spectral analysis using both the VERITAS and Fermi-LAT data.
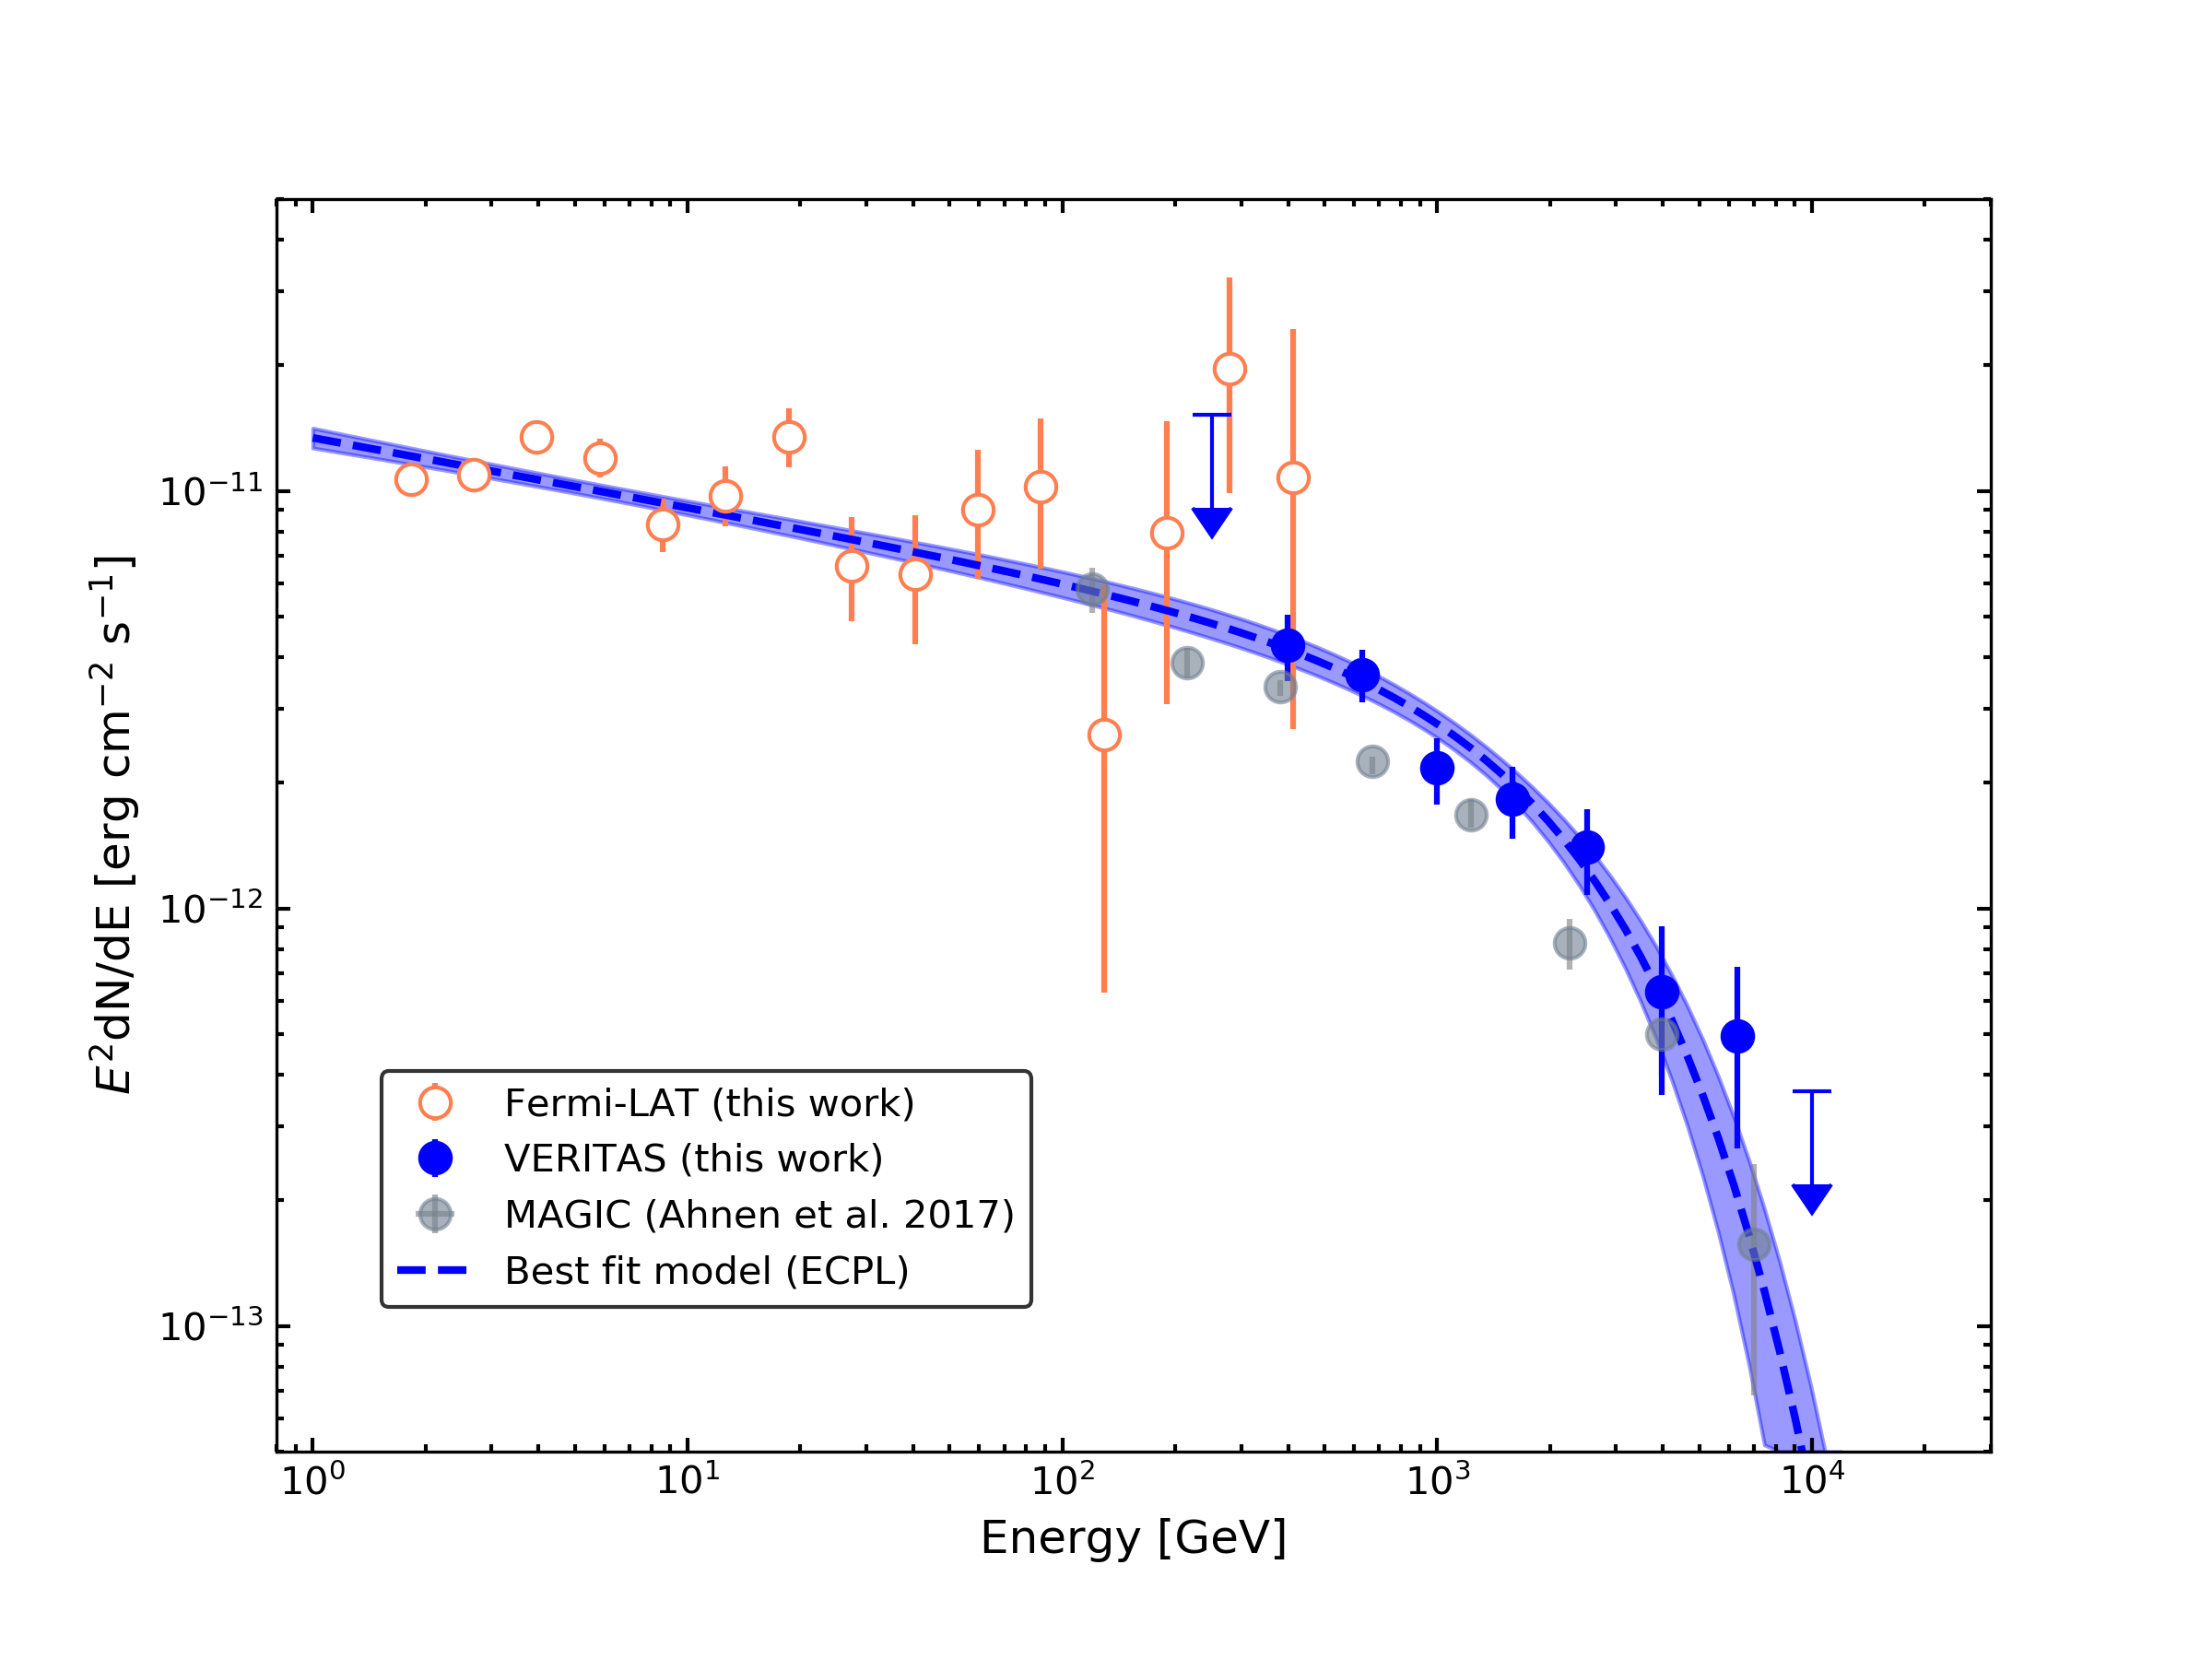
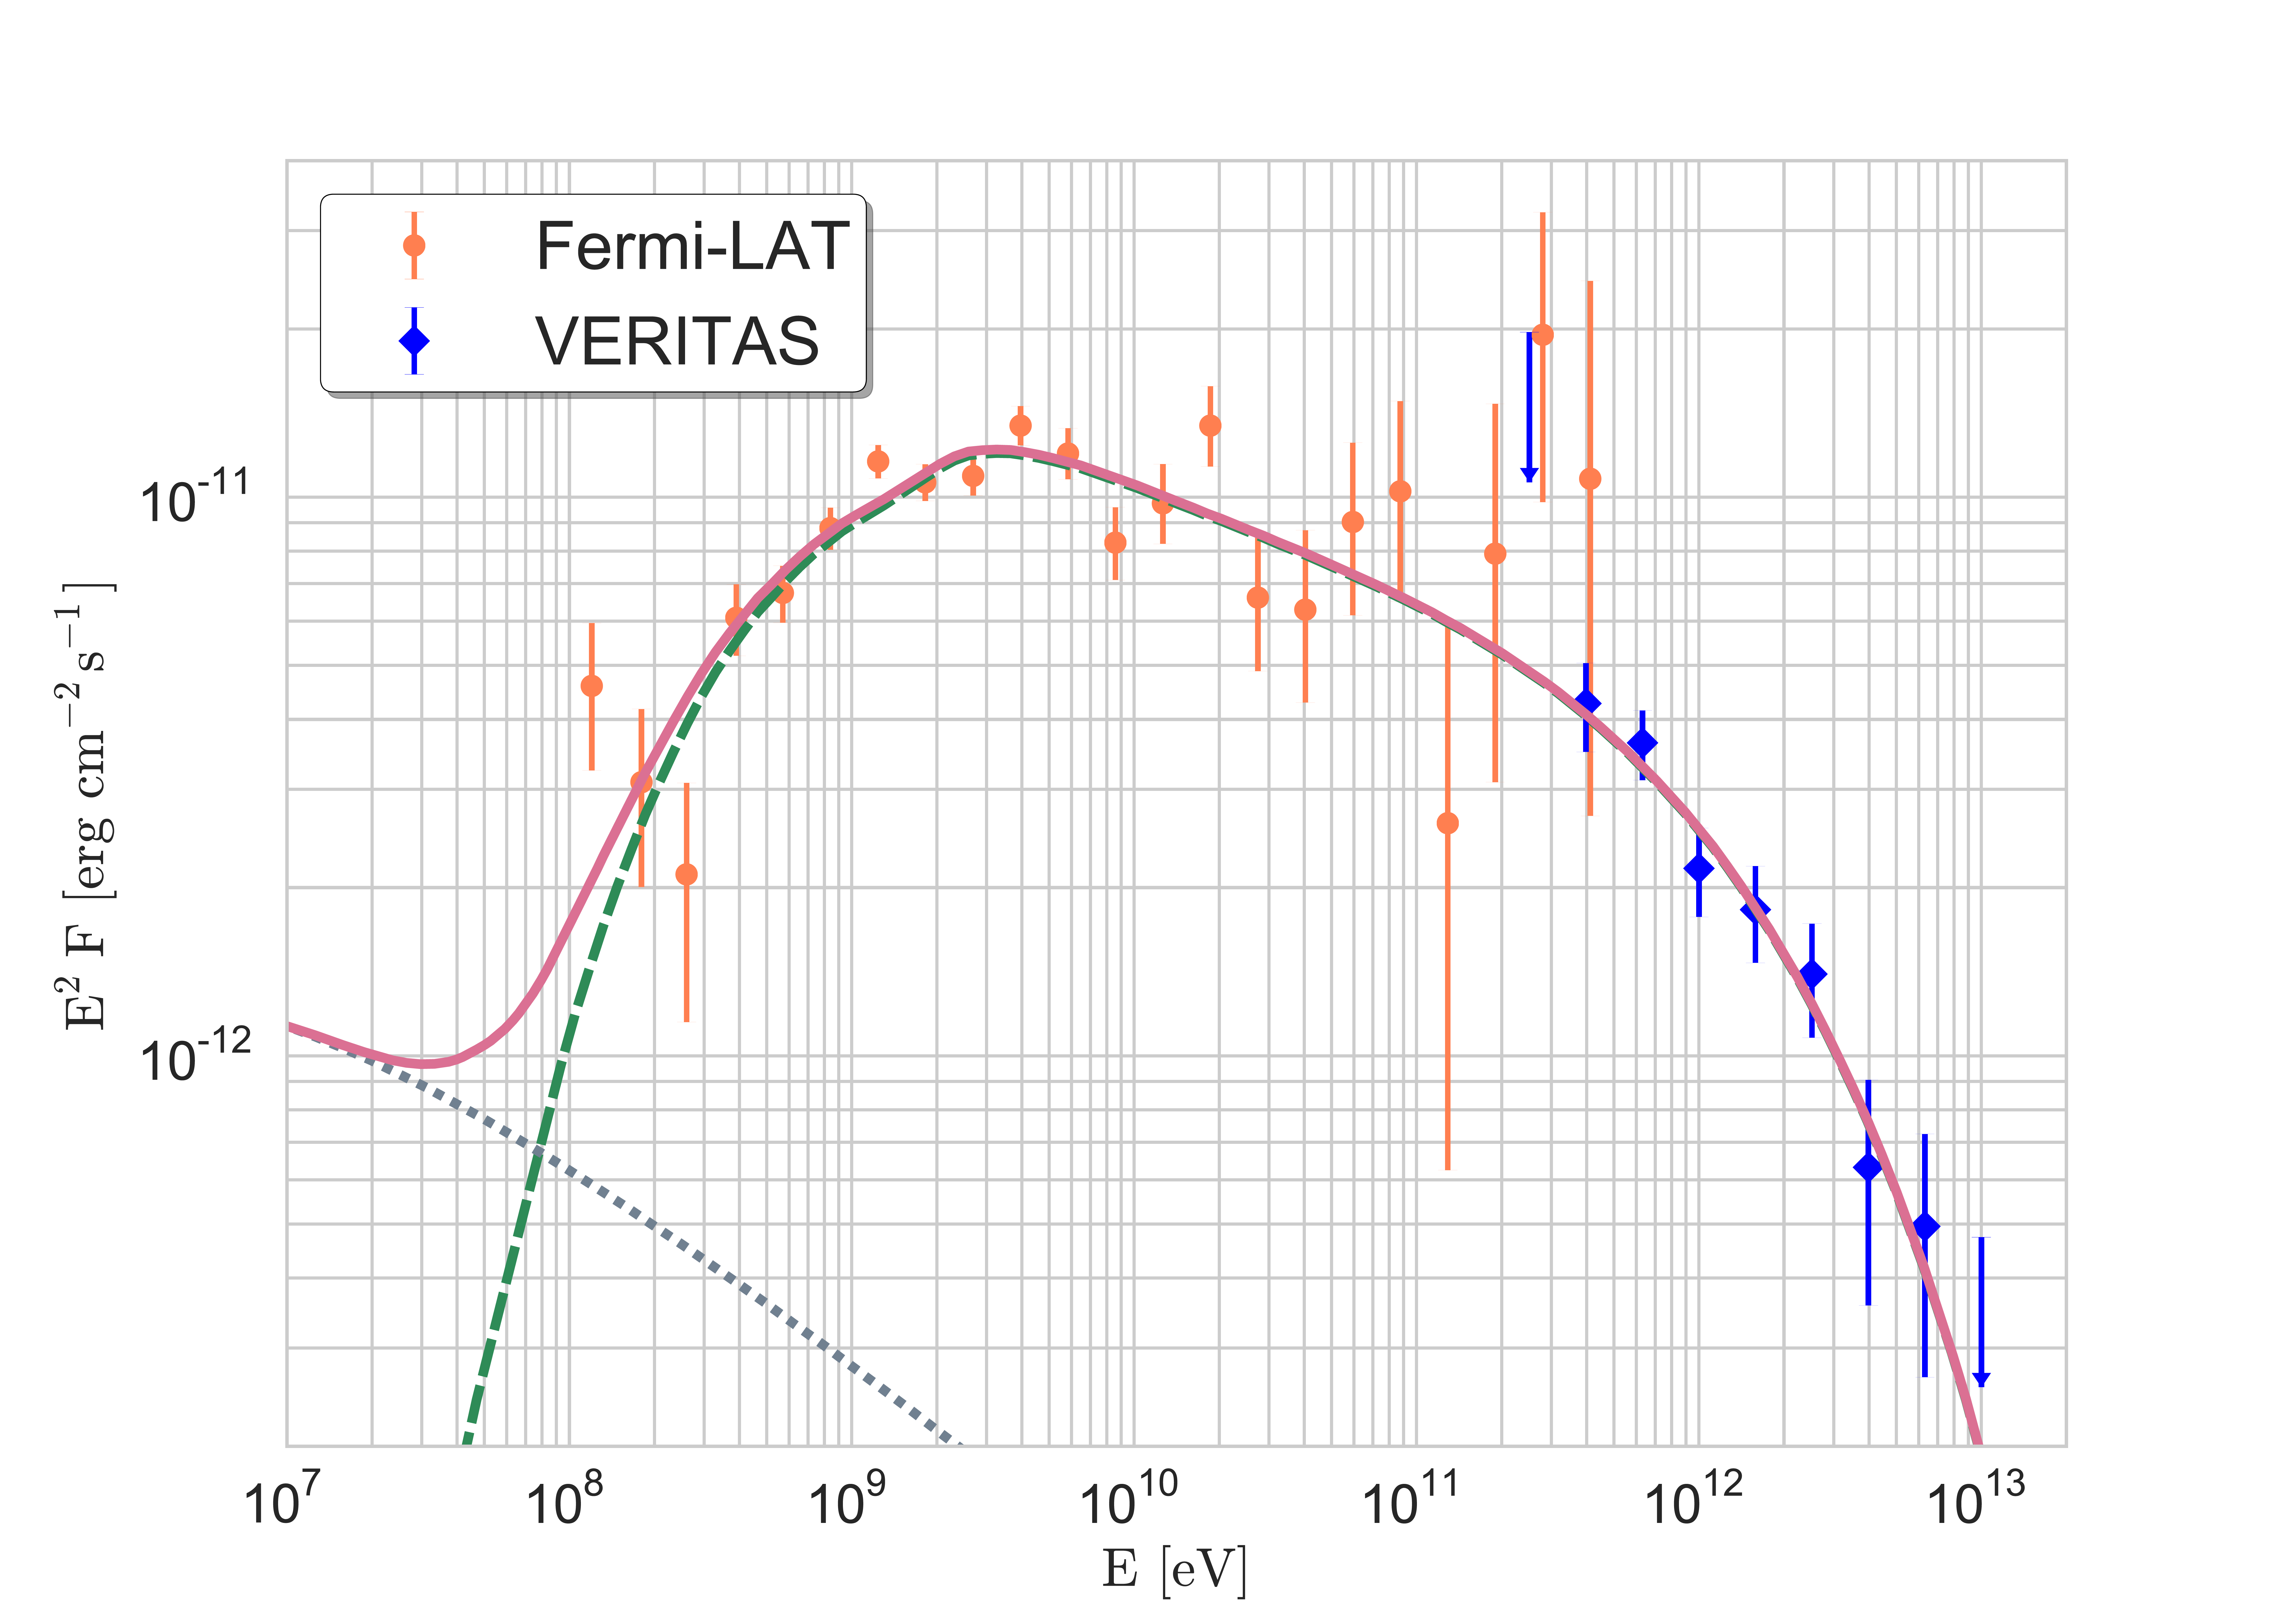
Using the VERITAS data, above the threshold energy of 200 GeV, the energy spectrum is well-described by a power-law (PL) distribution. Similarly, the spectral analysis was performed over the full Fermi-LAT energy range of 0.1 - 500 GeV. The spectral shape of the emission from Cas A was assumed to be smoothly broken power-law (see full paper for details of these and other spectral fits). We performed the broadband fit by taking spectral points from Fermi-LAT (above the spectral break only, i.e. > 1.3 GeV) and VERITAS and fi tting jointly using three di fferent models: a single PL, an exponential cut-off power-law (ECPL) and a smoothly-broken power law.
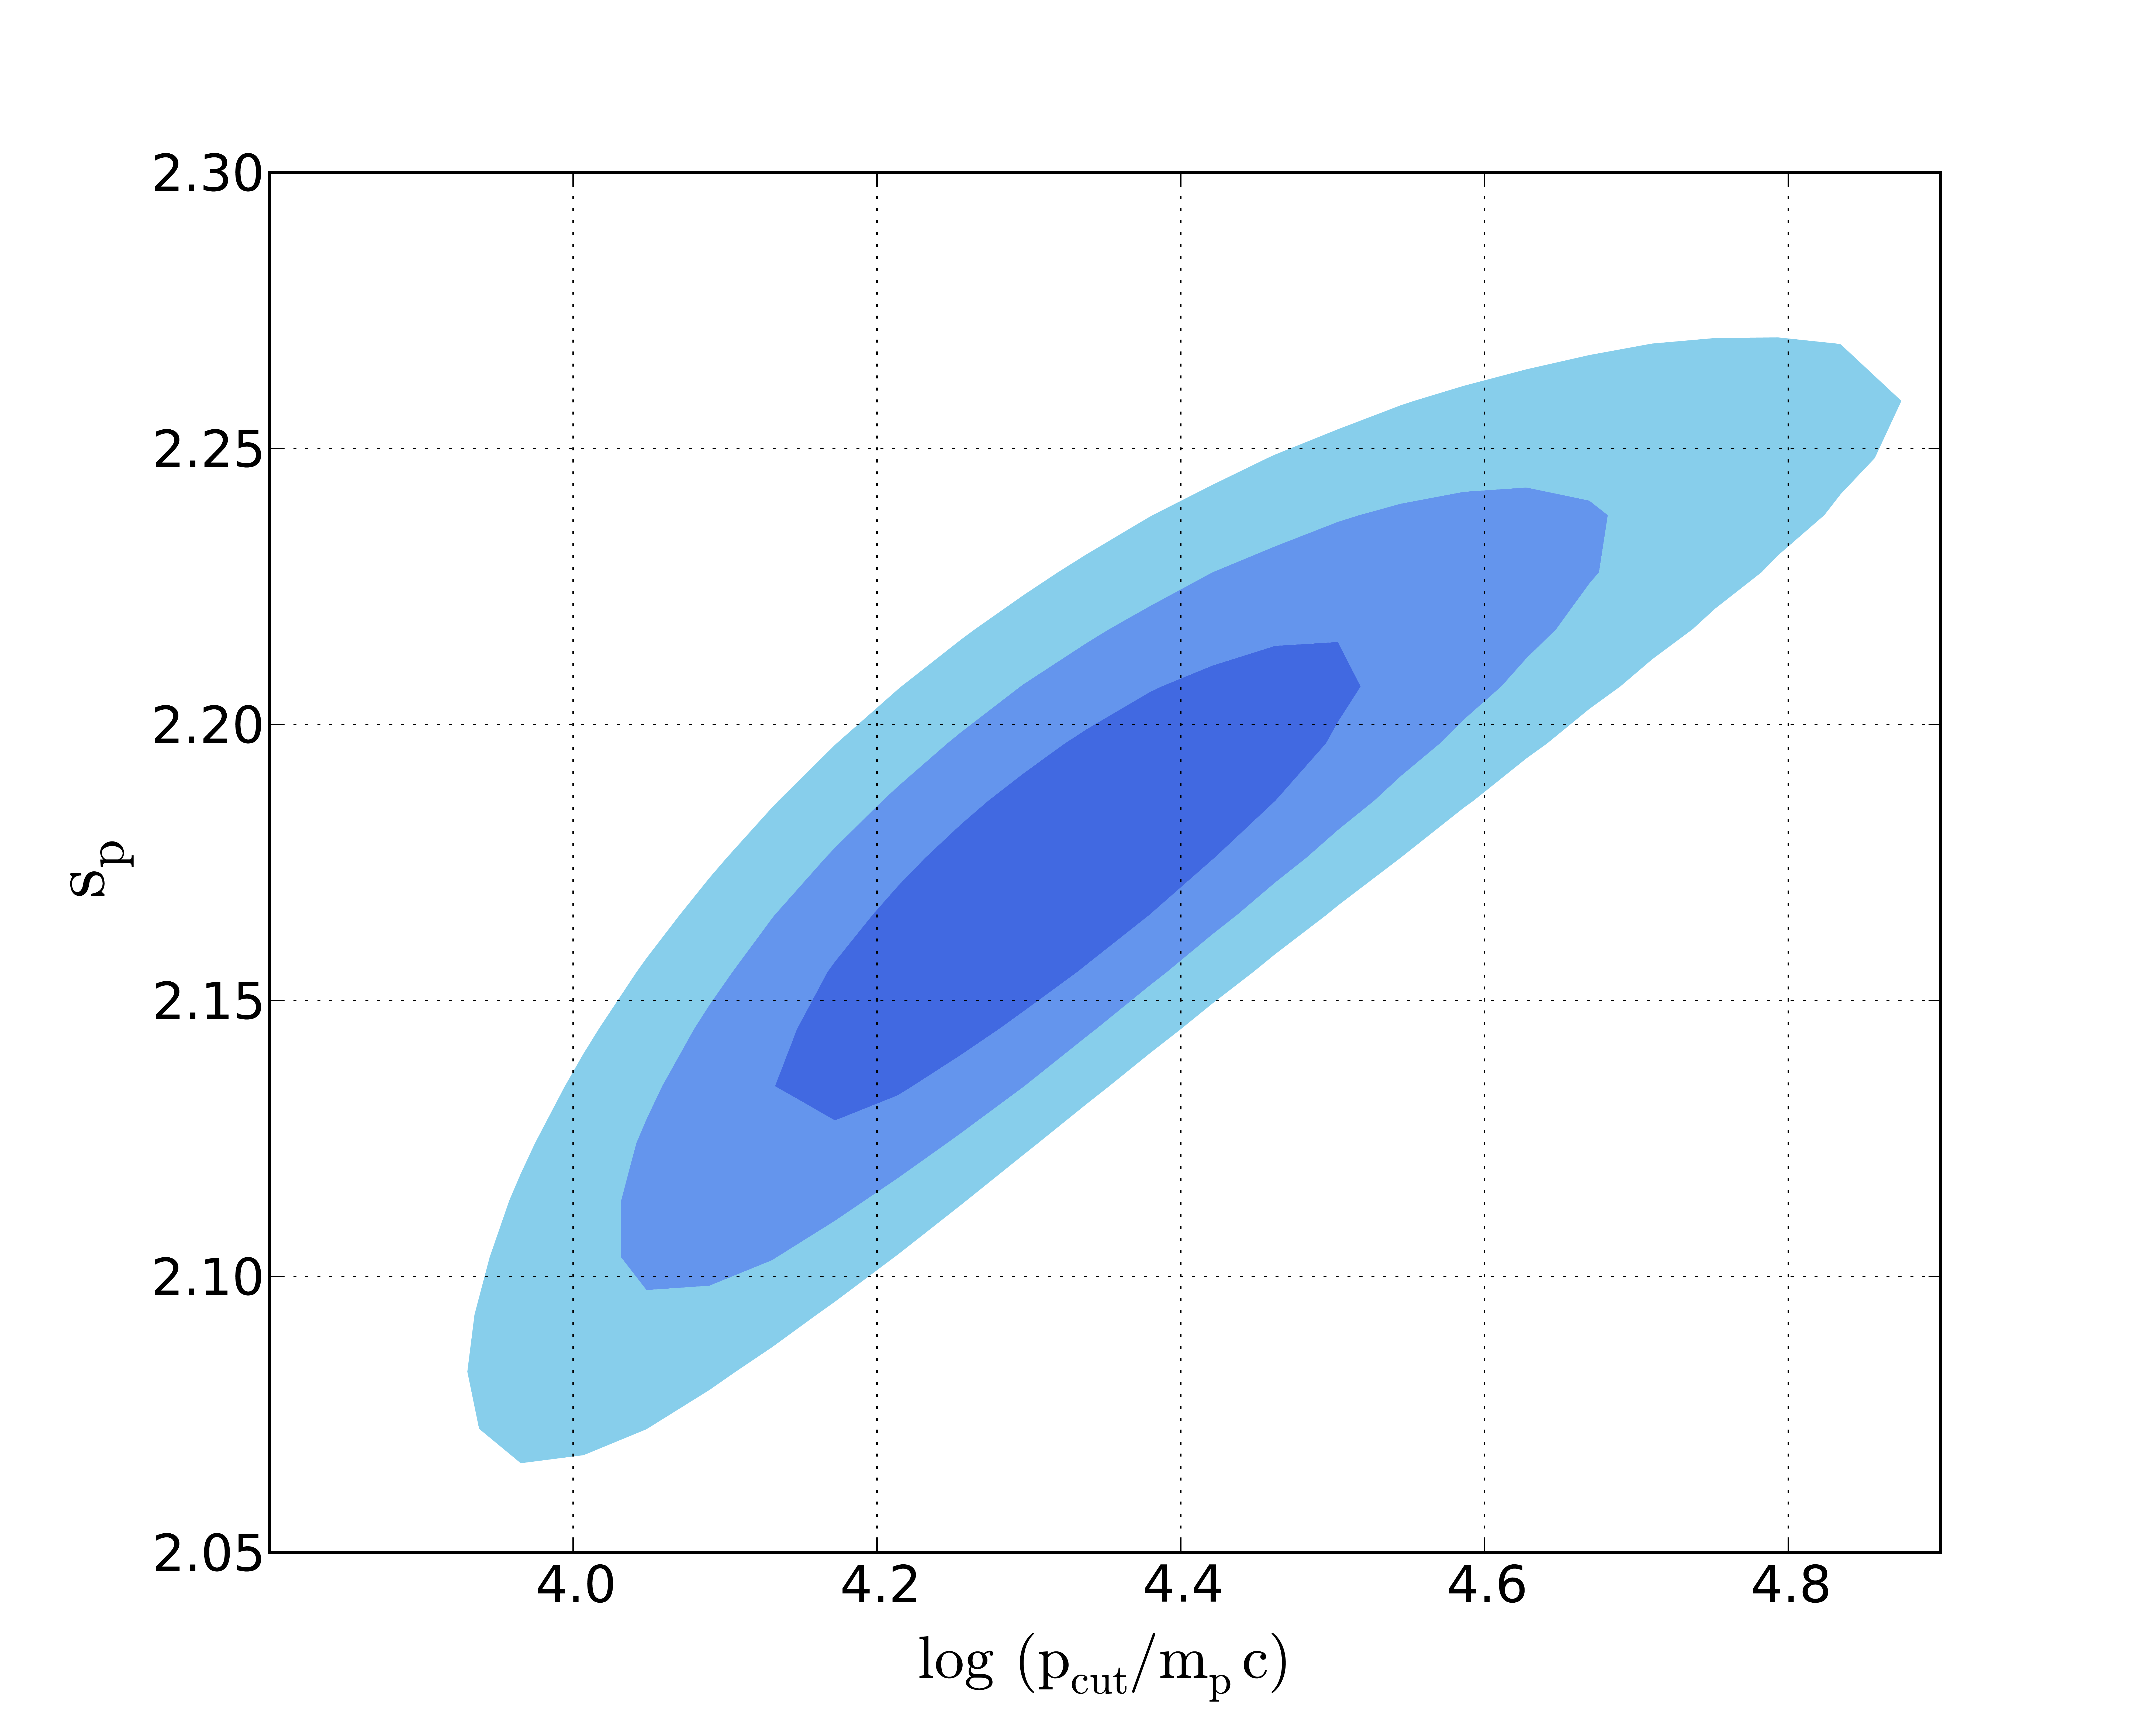
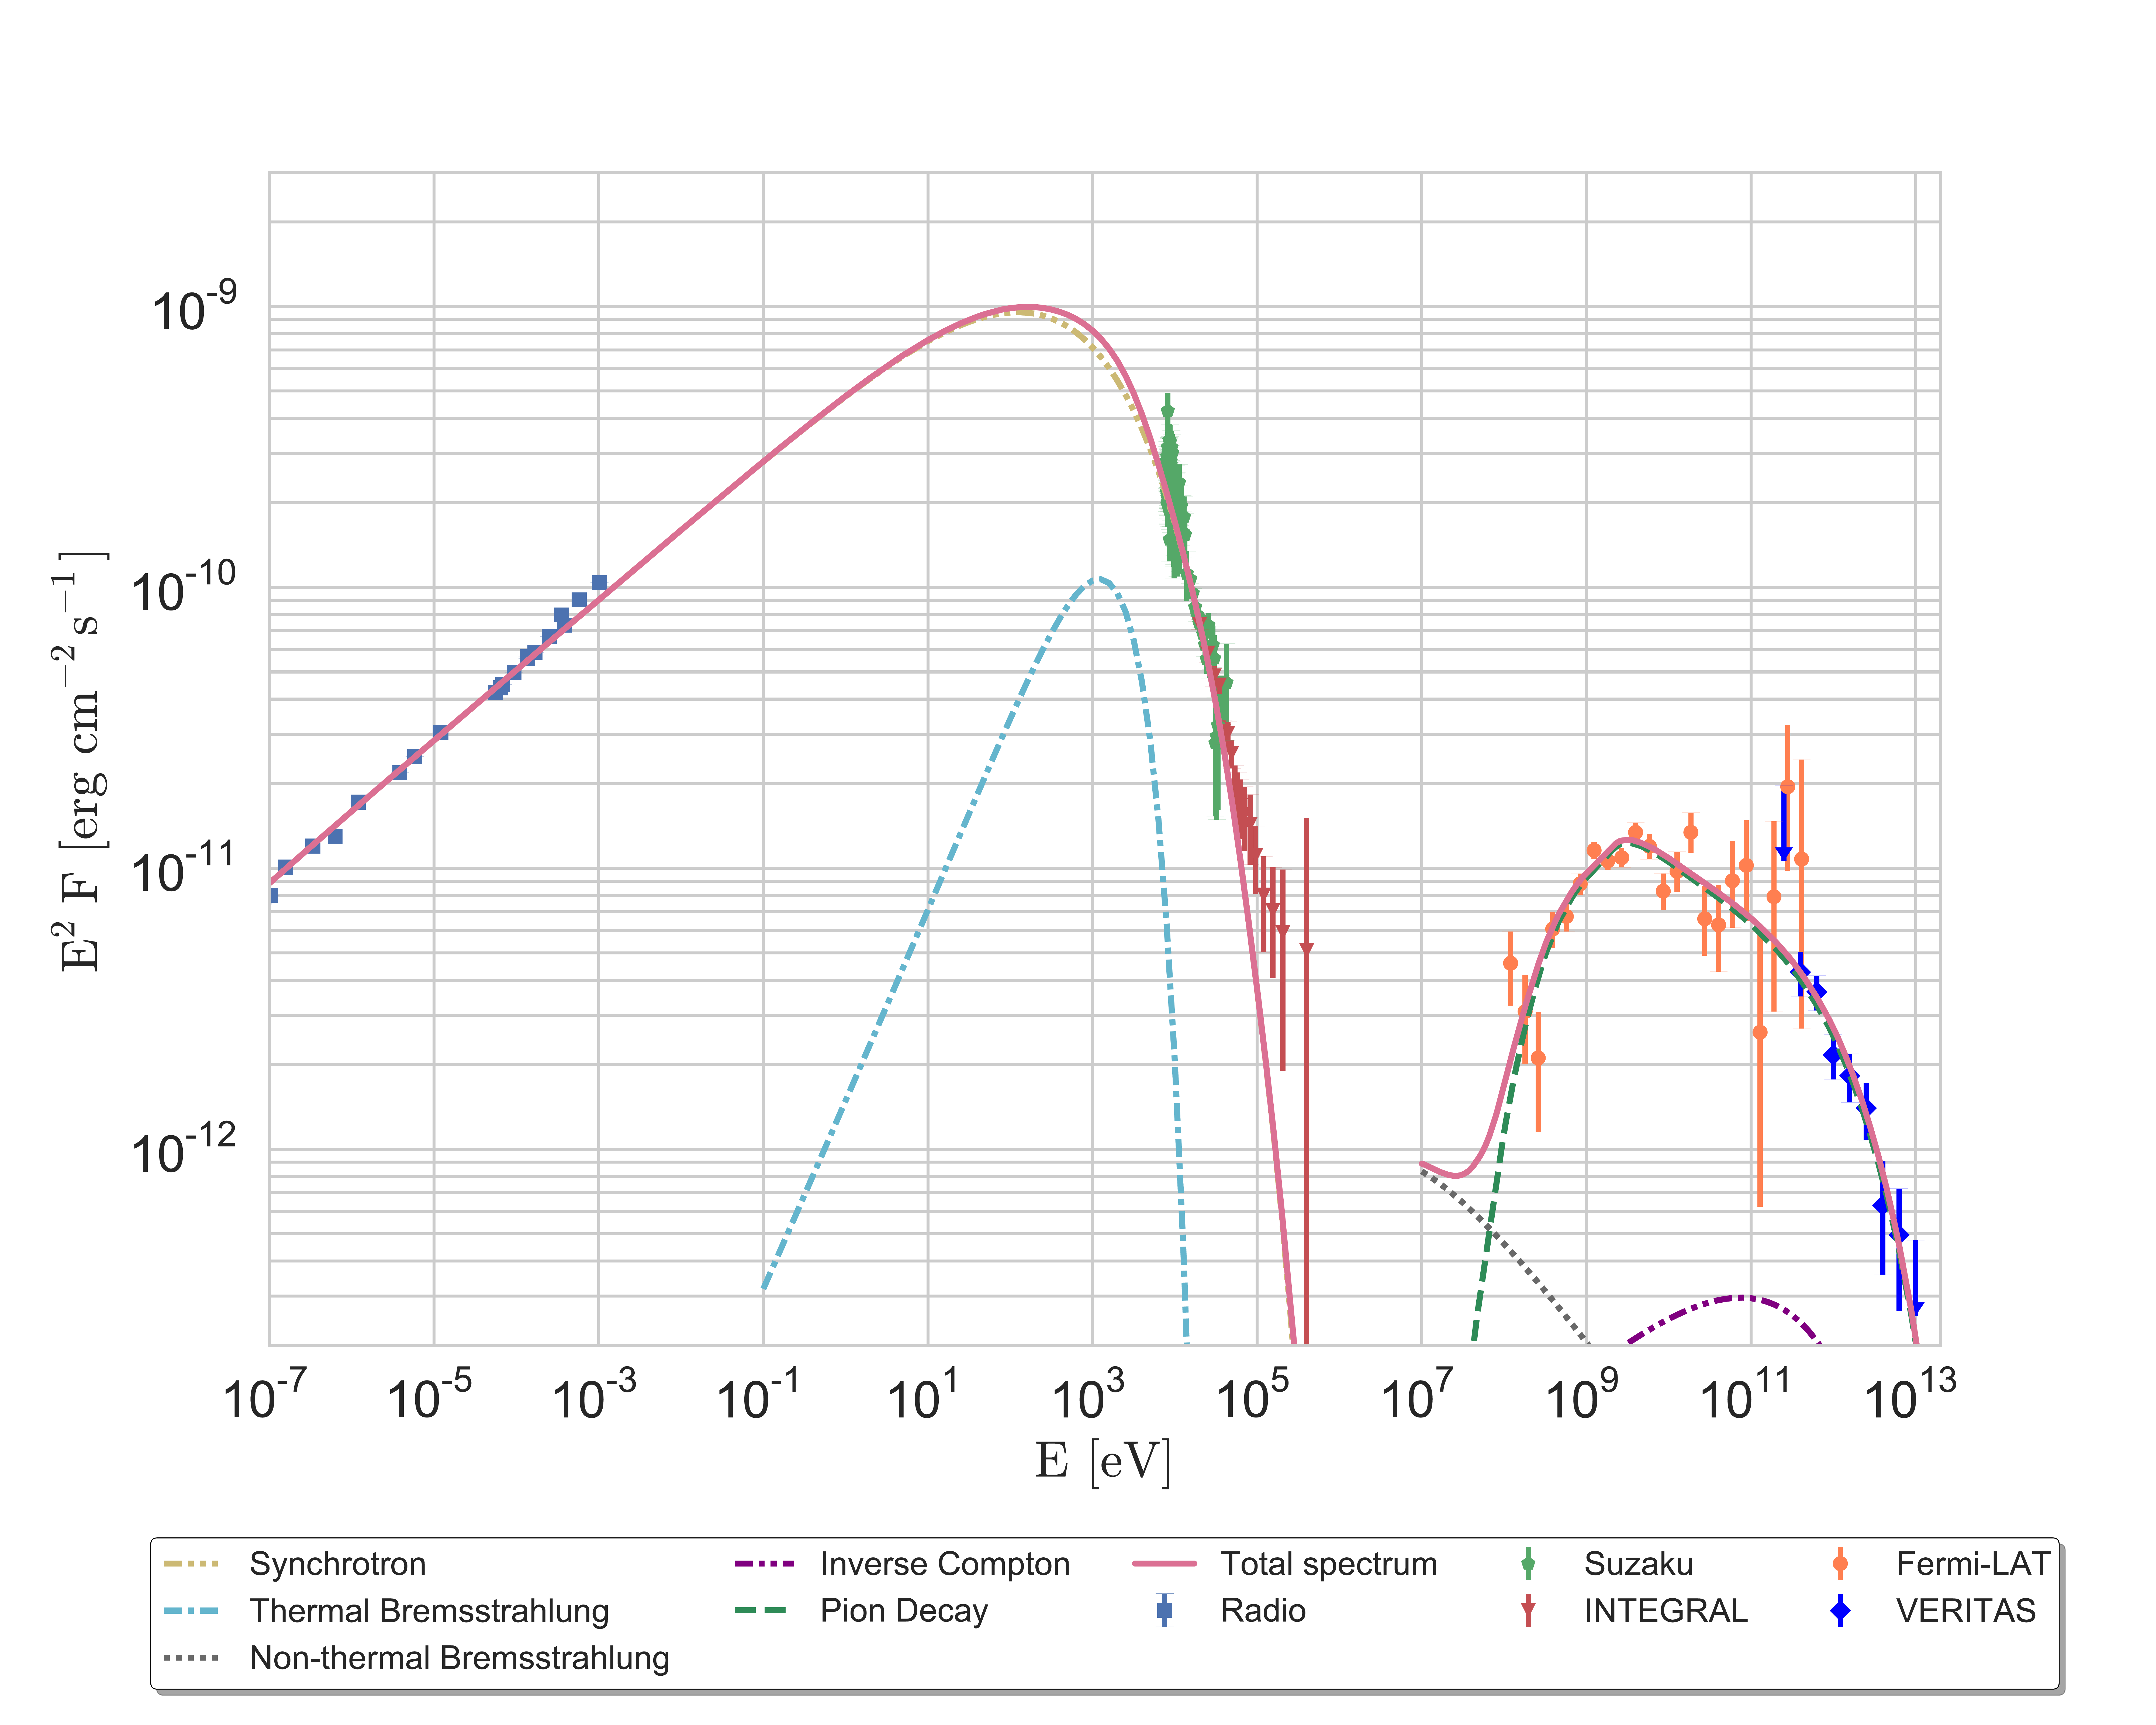
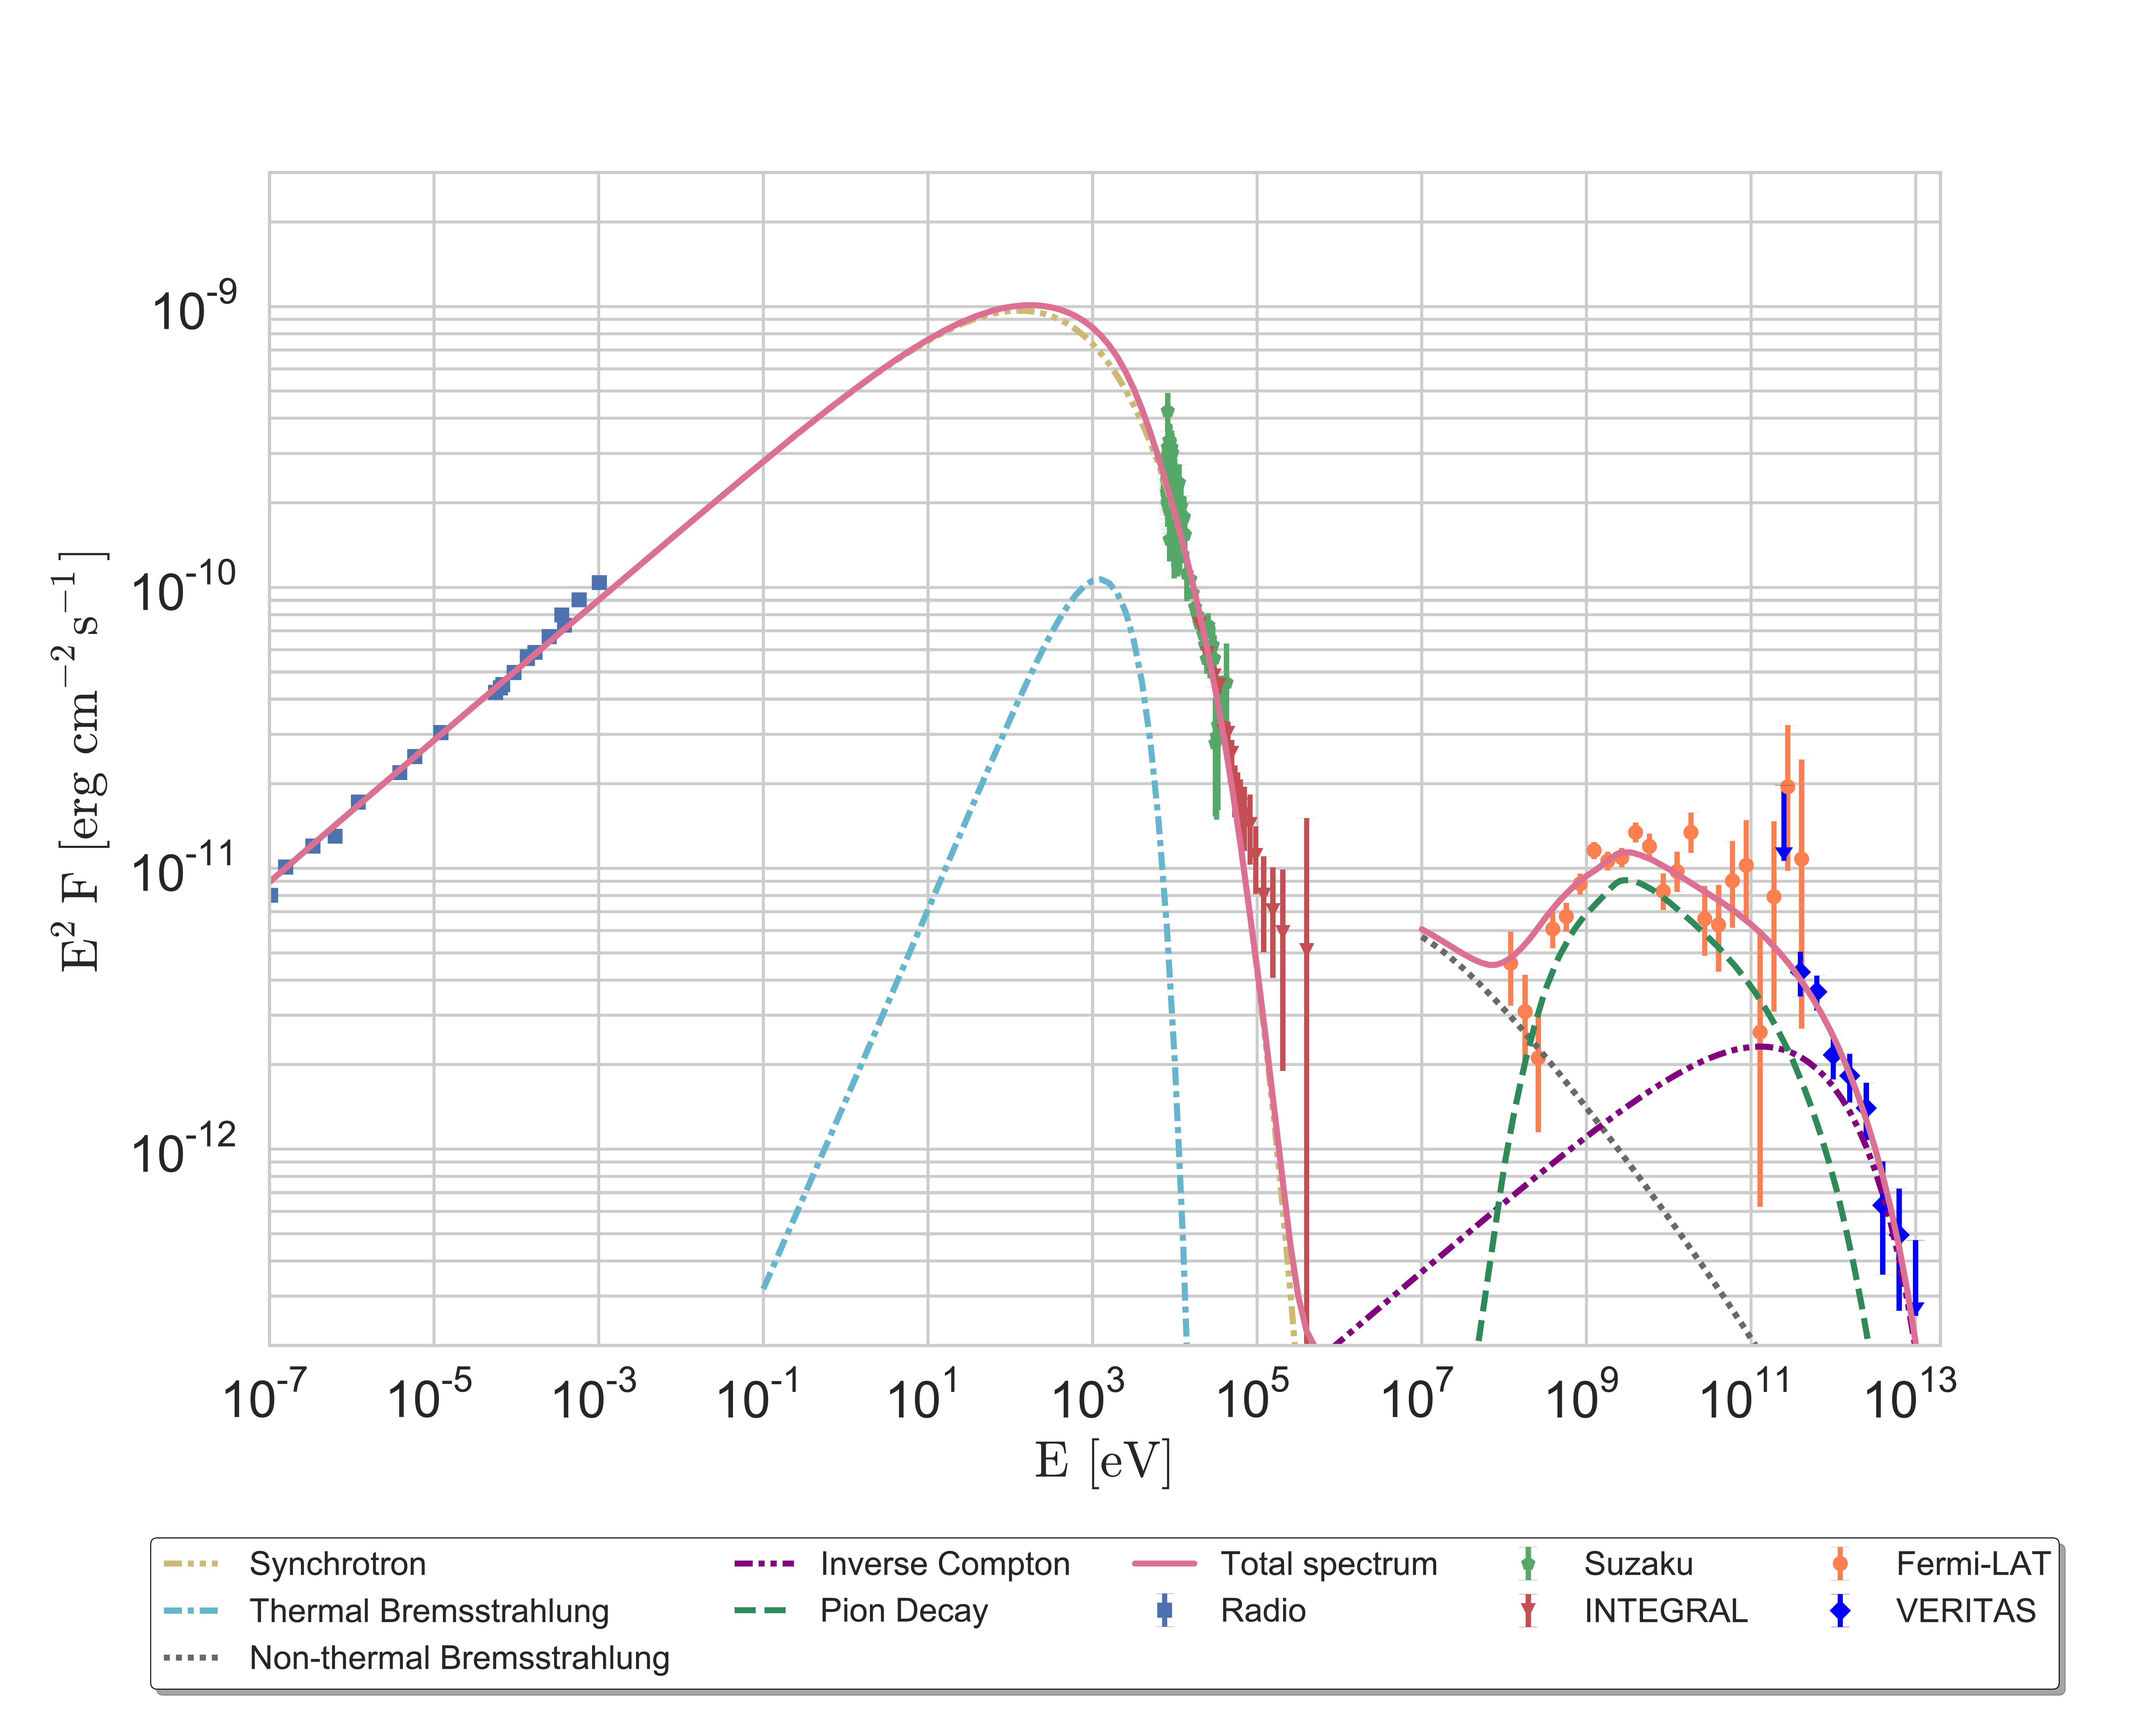
In the theoretical part of this work we take radio and X-ray observations into account. Considering the entire multi-wavelength spectrum of Cas A, we use a global one-zone model assuming power-law particle spectra with an exponential cut o ff. Two diff erent scenarios, a hadron-dominated case and a lepto-hadronic model are presented. Furthermore, a purely leptonic model is excluded under the assumption of a one-zone scenario, leading to the conclusion that proton acceleration up to TeV energies is clearly evident (for model parameters, see Table 2 in the paper). The resulting pion bump reflects a slightly softer spectral index for the proton spectrum than the canonical diffusive shock acceleration (DSA) predictions (both linear and non-linear versions). We exclude the canonical DSA solution of s = 2.0 with 3σ confidence. The total energy converted into cosmic rays is at least 1050 erg, giving an acceleration efficiency of ~ 0.03 - 0.05.
Although Cas A is the best SNR candidate for non-thermal bremsstrahlung (NTB) emission, our observations do not indicate any evidence for a NTB flux above 100 MeV. A clear determination may be achieved with the photon measurements extended down to the MeV energy range. Future experiments, such as AMEGO1 (All-Sky Medium Energy Gamma-ray Observatory), may shed light on that issue. Nevertheless, assuming a potential NTB presence in Cas A, we set a minimum value for the magnetic-fi eld strength inside the remnant of Bmin ~ 150 G. This value is independently confi rmed by the inverse-Compton peak. Therefore, it is clear that the magnetic fi eld inside the Cas A SNR is effi ciently ampli fied, when compared to the interstellar-medium field.
FITS files: N/A
Figures from paper (click to get full size image):