SED data-model comparisons - see Figure 6 below for details.
Reference: A. Archer et al. (The VERITAS Collaboration), Astrophysical Journal 888: 115, 2020
Full text version
ArXiv: ArXiV:1911.09434
Contacts: Raul Prado
In this paper, we present combined observations by VERITAS and the X-ray observatory NuSTAR of the puzzling gamma-ray binary HESS J0632+057. The SED derived from these simultaneous observations are then interpreted under the assumption that the compact object is a pulsar and the non-thermal radiation is produced by the interaction between the stellar and pulsar wind. The results provide valuable constraints on the pulsar wind magnetization parameter at a distance from pulsar range that is poorly constrained by other types of system.
FITS files: N/A
Figures from paper (click to get full size image):

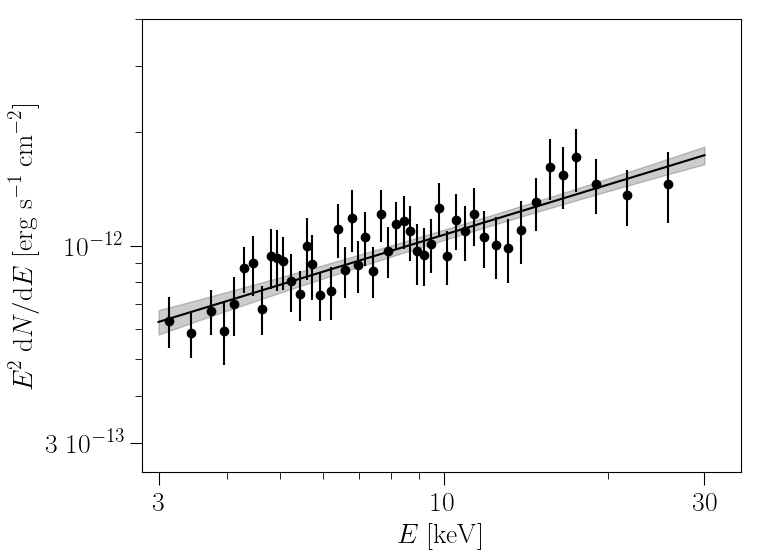
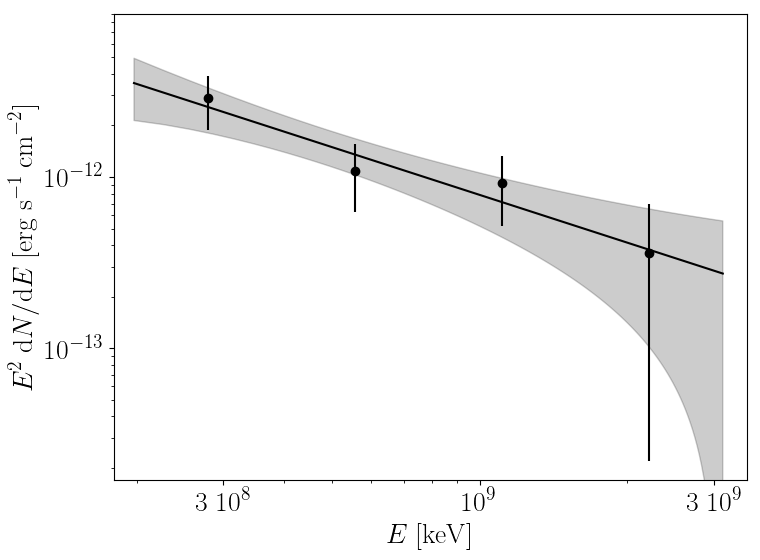
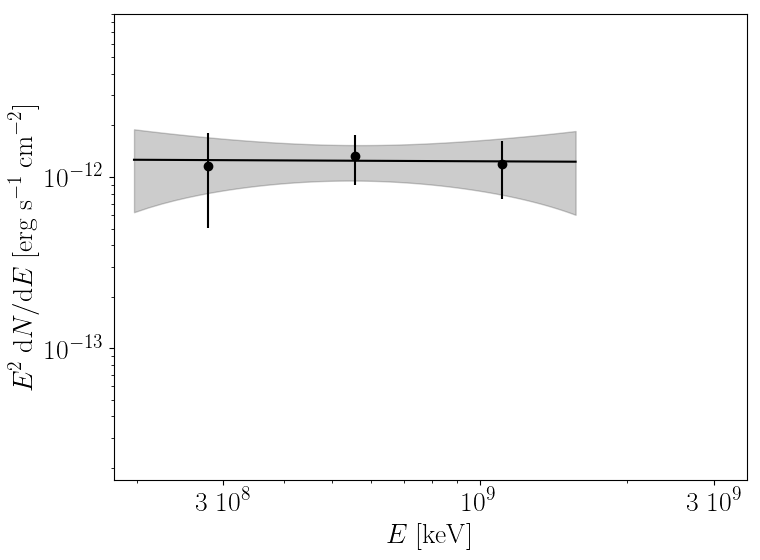
Figure 1: SED derived from NuSTAR (upper panels) and VERITAS (lower panels) observations from November (left) and December (right) 2017. The dashed lines show the result of the single power law fi t
and the gray band its 1- σ confi dence interval.
and the gray band its 1- σ confi dence interval.
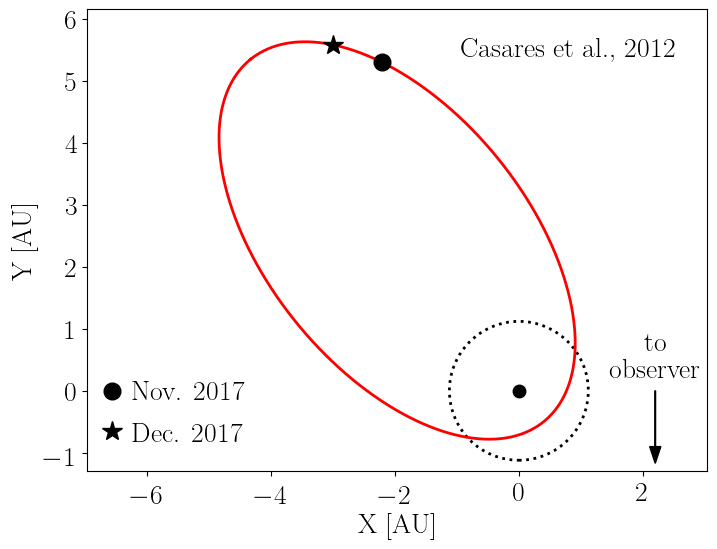
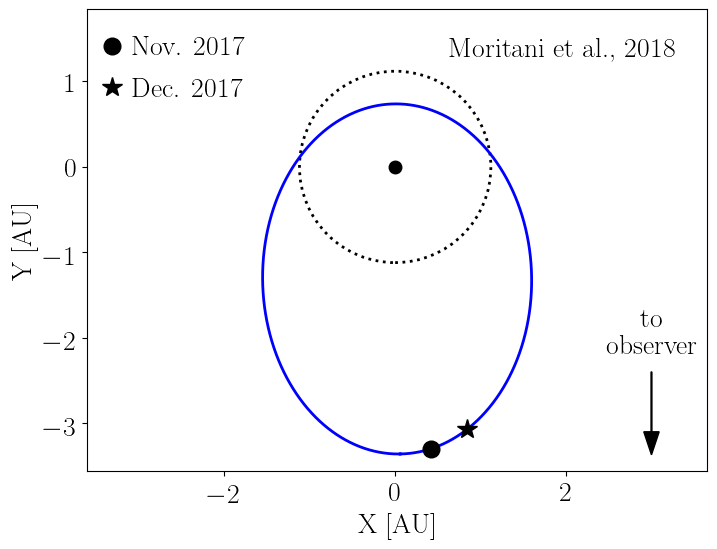
Figure 2: Illustration of the orbit of the compact object projected onto the orbital plane for Casares et al. (2012) (left) and Moritani et al. (2018) (right) solutions. The semi-major axis of the compact object (a2) was
calculated for the corresponding inclination (i) and mass function (f(M)) as given in Tab. 1. The locations of the compact object during the two sets of observations are indicated as black markers. The companion
star is assumed to be in a fi xed position and the estimated size of the circumstellar disk (Moritani et al. 2015; Zamanov et al. 2016) is indicated by a dashed black line.
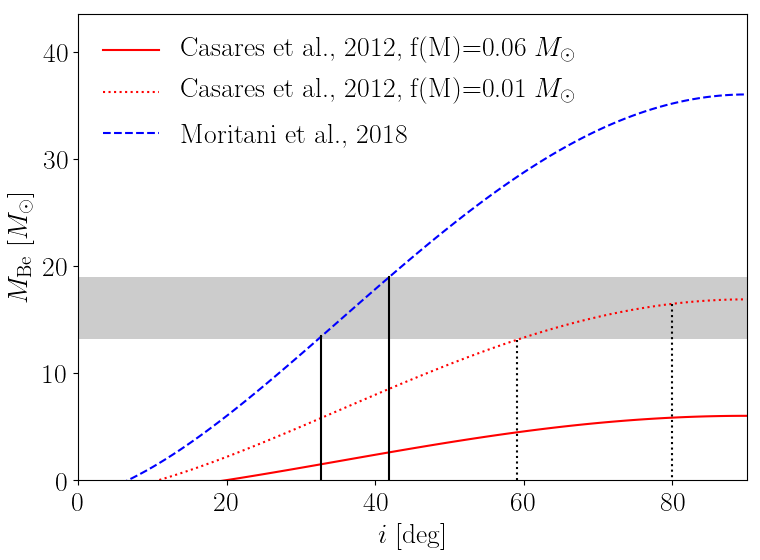
Figure 3: The mass of the companion star (MBe) as a function of the inclination (i) following the mass function given by the orbital solutions. The gray band indicates the allowed range of MBe derived by Aragona et al. (2010). The vertical solid and dotted lines indicate the limits of i used in this work for the Casares et al. (2012) and Moritani et al. (2018) solutions, respectively.
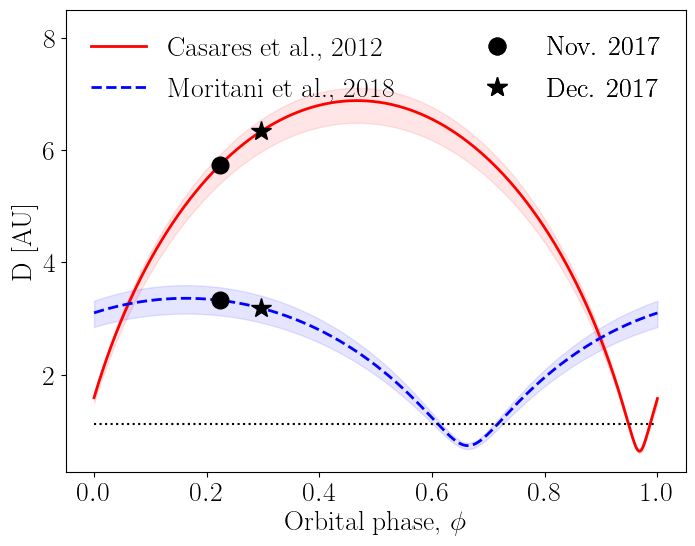
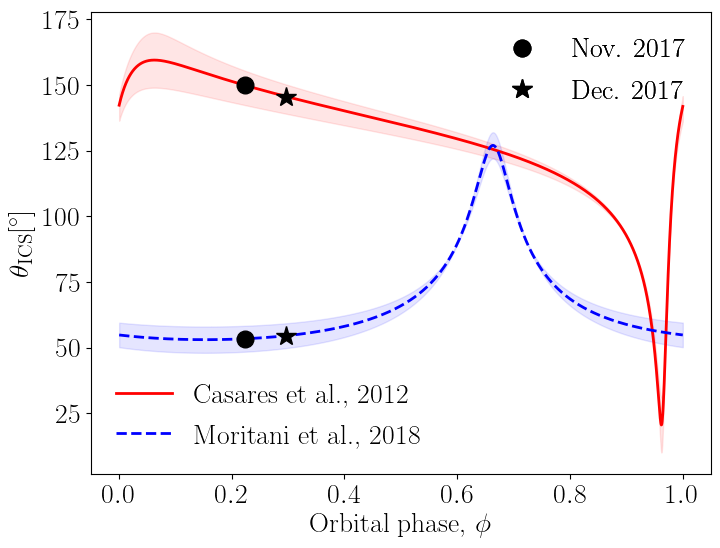
Figure 4: Distance between the Be star and the pulsar (left) and ICS angle (right) derived from the orbital solutions by Casares et al. (2012) and Moritani et al. (2018). The black markers indicate our two sets of observations, the dashed black line in the left panel indicates the estimated size of the circumstellar disk, and the colored bands indicate the uncertainties due to the system's inclination (see text for details).
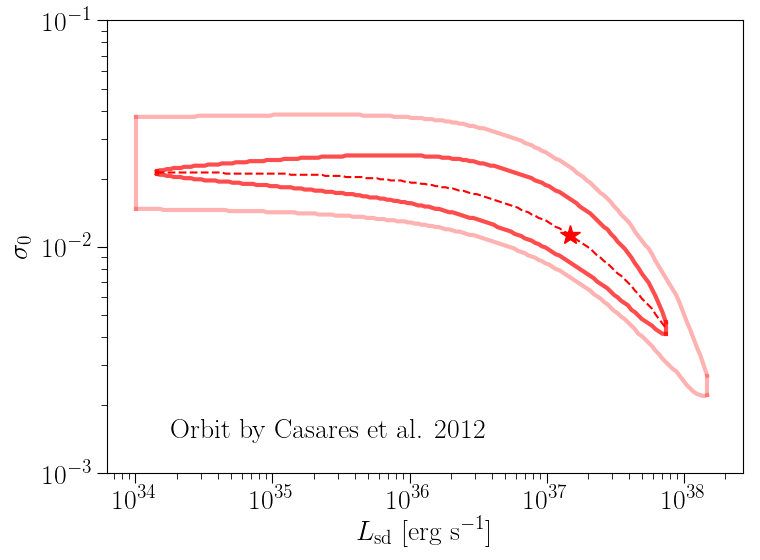
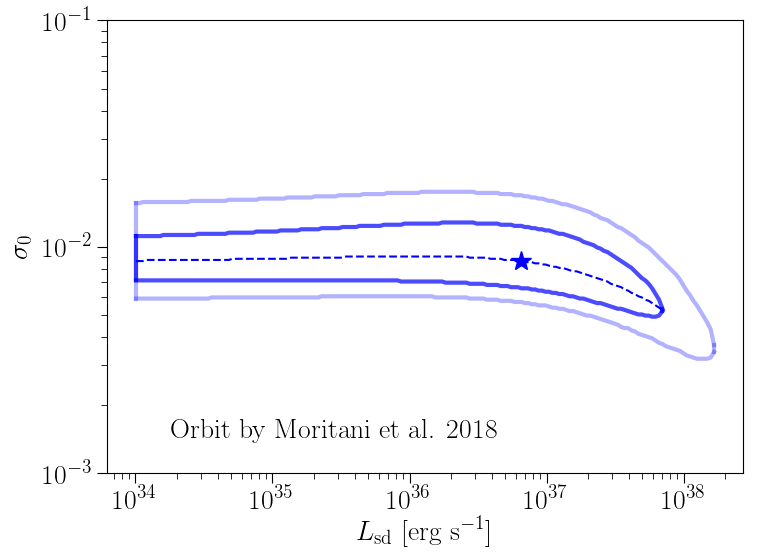
Figure 5: Results of the model fitting in the Lsd - σ 0 plane for the sets of orbital parameters from Casares et al. (2012) (left) and Moritani et al. (2018) (right). The best solution is indicated by a star while the 1- and 2-σ regions are indicated by the darker and lighter continuous lines, respectively. The dashed lines show the values of σ 0 that minimize the χ2 for each value of Lsd.
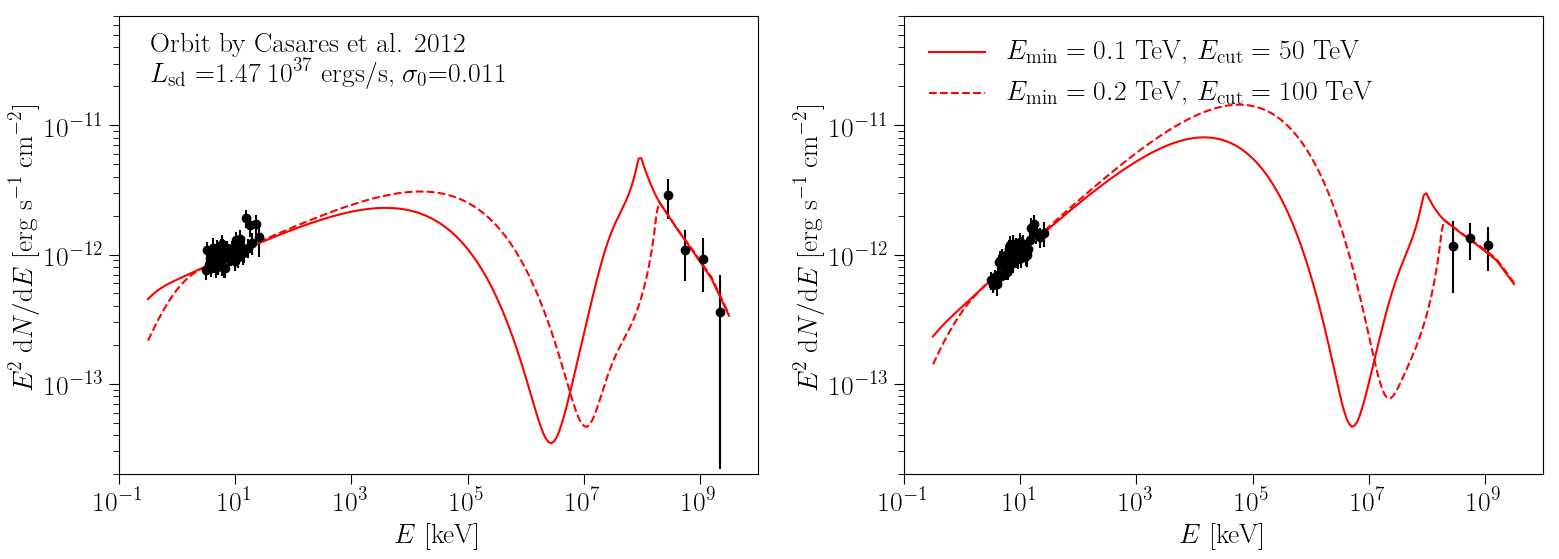
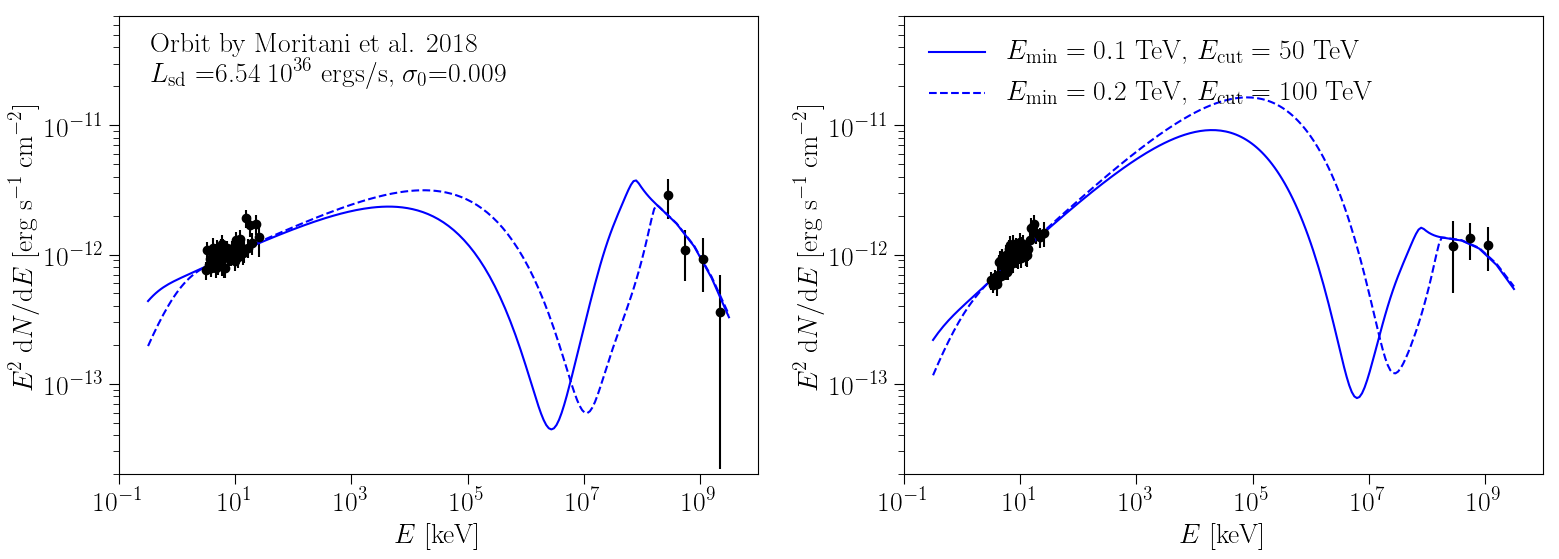
Figure 6: SED data-model comparison assuming the best solution of the model fitting for the Casares et al. (2012) (upper) and Moritani et al. (2018) (lower) orbital solutions. The November and December 2017 observations are shown in the left and right panels, respectively. The diff erent line styles indicate diff erent assumptions of Emin and Ecut.
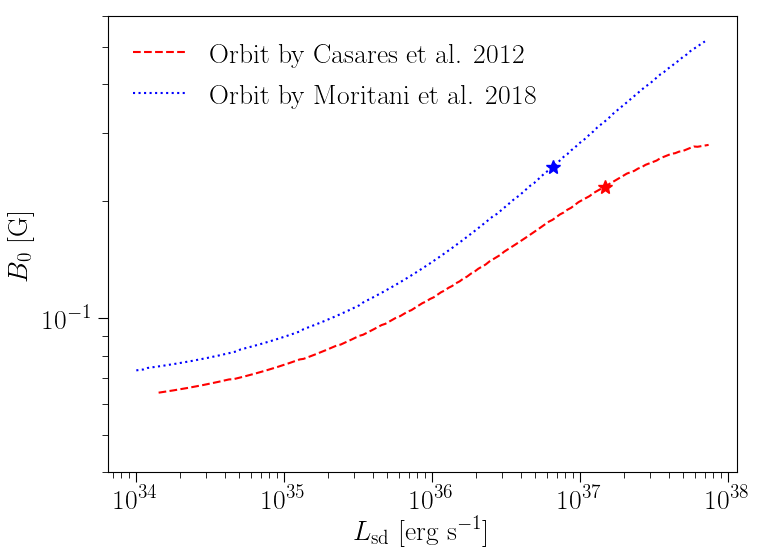
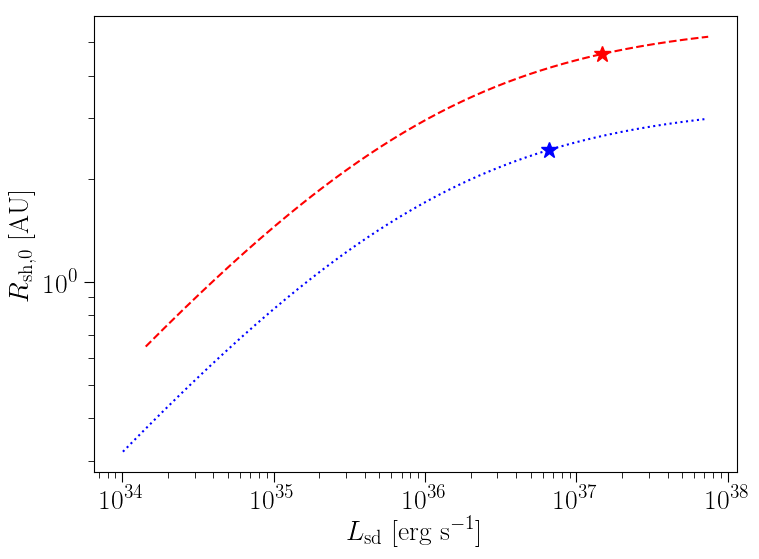
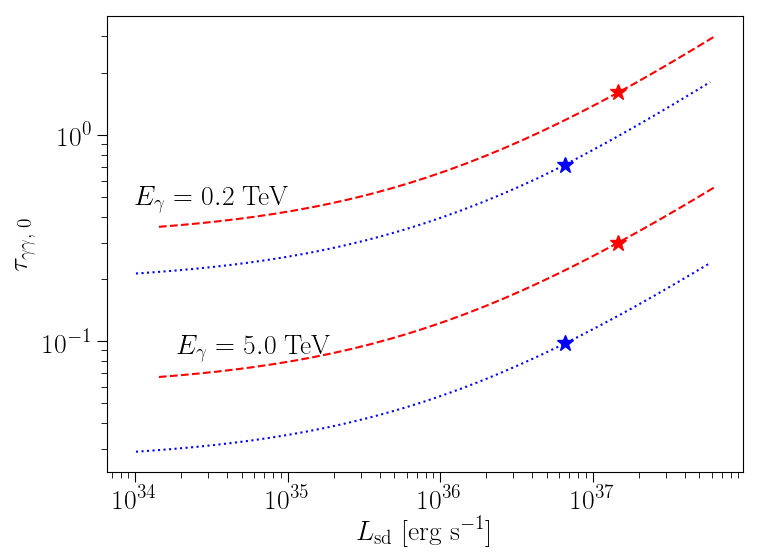
Figure 7: B- field (upper), shock distance to the pulsar (middle) and pair production optical depth (lower) for the earlier set of observations as a function of Lsd. The lines represent the best curves and the stars show the best solutions. The optical depth τγγ;0 is shown for gamma-ray photon energies of 0.2 (upper lines) and 5.0 TeV (bottom lines).
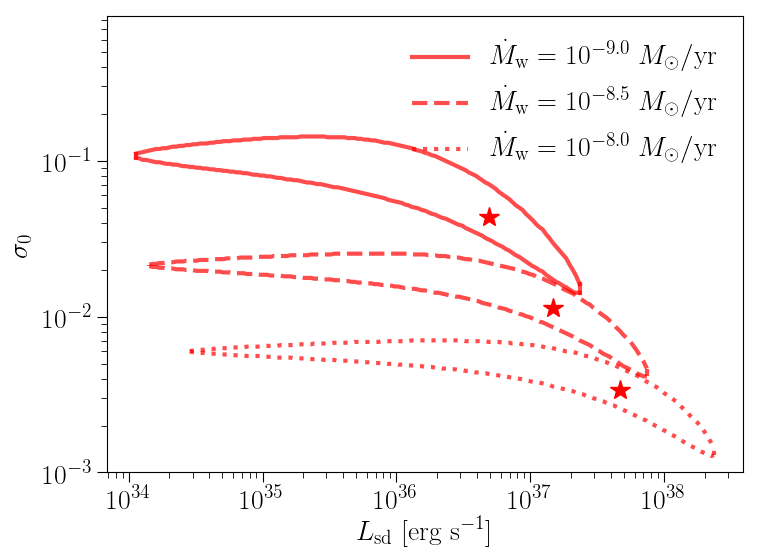
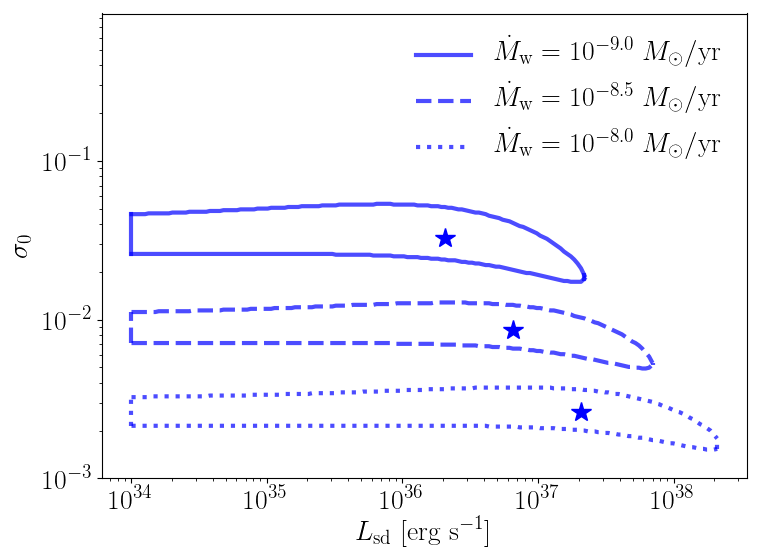
Figure 8: Results of the model fitting in the Lsd-σ 0 plane for diff erent values of Mw within the range 109 - 108 solar masses /yr. The orbital solutions by Casares et al. (2012) and Moritani et al. (2018) are shown in the left and right panel, respectively. The lines indicate the 1 σ region of the parameters.
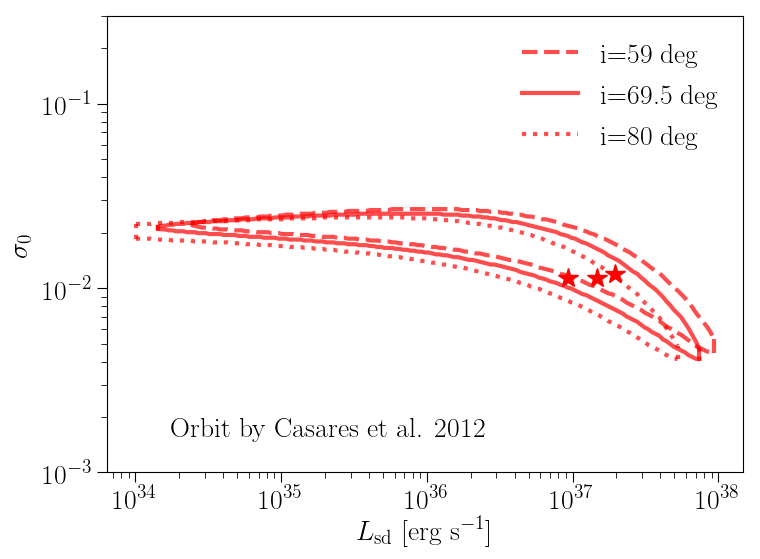

Figure 9: Results of the model fitting in the Lsd-σ 0 plane for diff erent values of inclination as described in Sec. 4. The orbital solutions by Casares et al. (2012) and Moritani et al. (2018) are shown in the left and right panel, respectively. The lines indicate the 1 σ region of the parameters.

Figure 10: Pulsar-wind magnetization vs Rsh, obtained from the results of our model fitting, compared to a selection of theoretical and observational constraints (see text for details).