Reference: A.U. Abeysekara et al. (The VERITAS Collaboration), Astrophysical Journal 885: 150, 2019
Full text version
ArXiv: ArXiV:1910.00451
Contacts: Elisa Pueschel
Diffuse photon fields encode information about energy release over the Universe's evolution. The extragalactic background light (EBL), which spans the optical and infrared range, is dominated in the optical range by stellar emission, and in the infrared range by re-radiation of starlight after absorption by dust. It also includes contributions from energy release during galaxy formation and accretion onto active galactic nuclei. While challenging to measure directly, it can be studied through the measurements
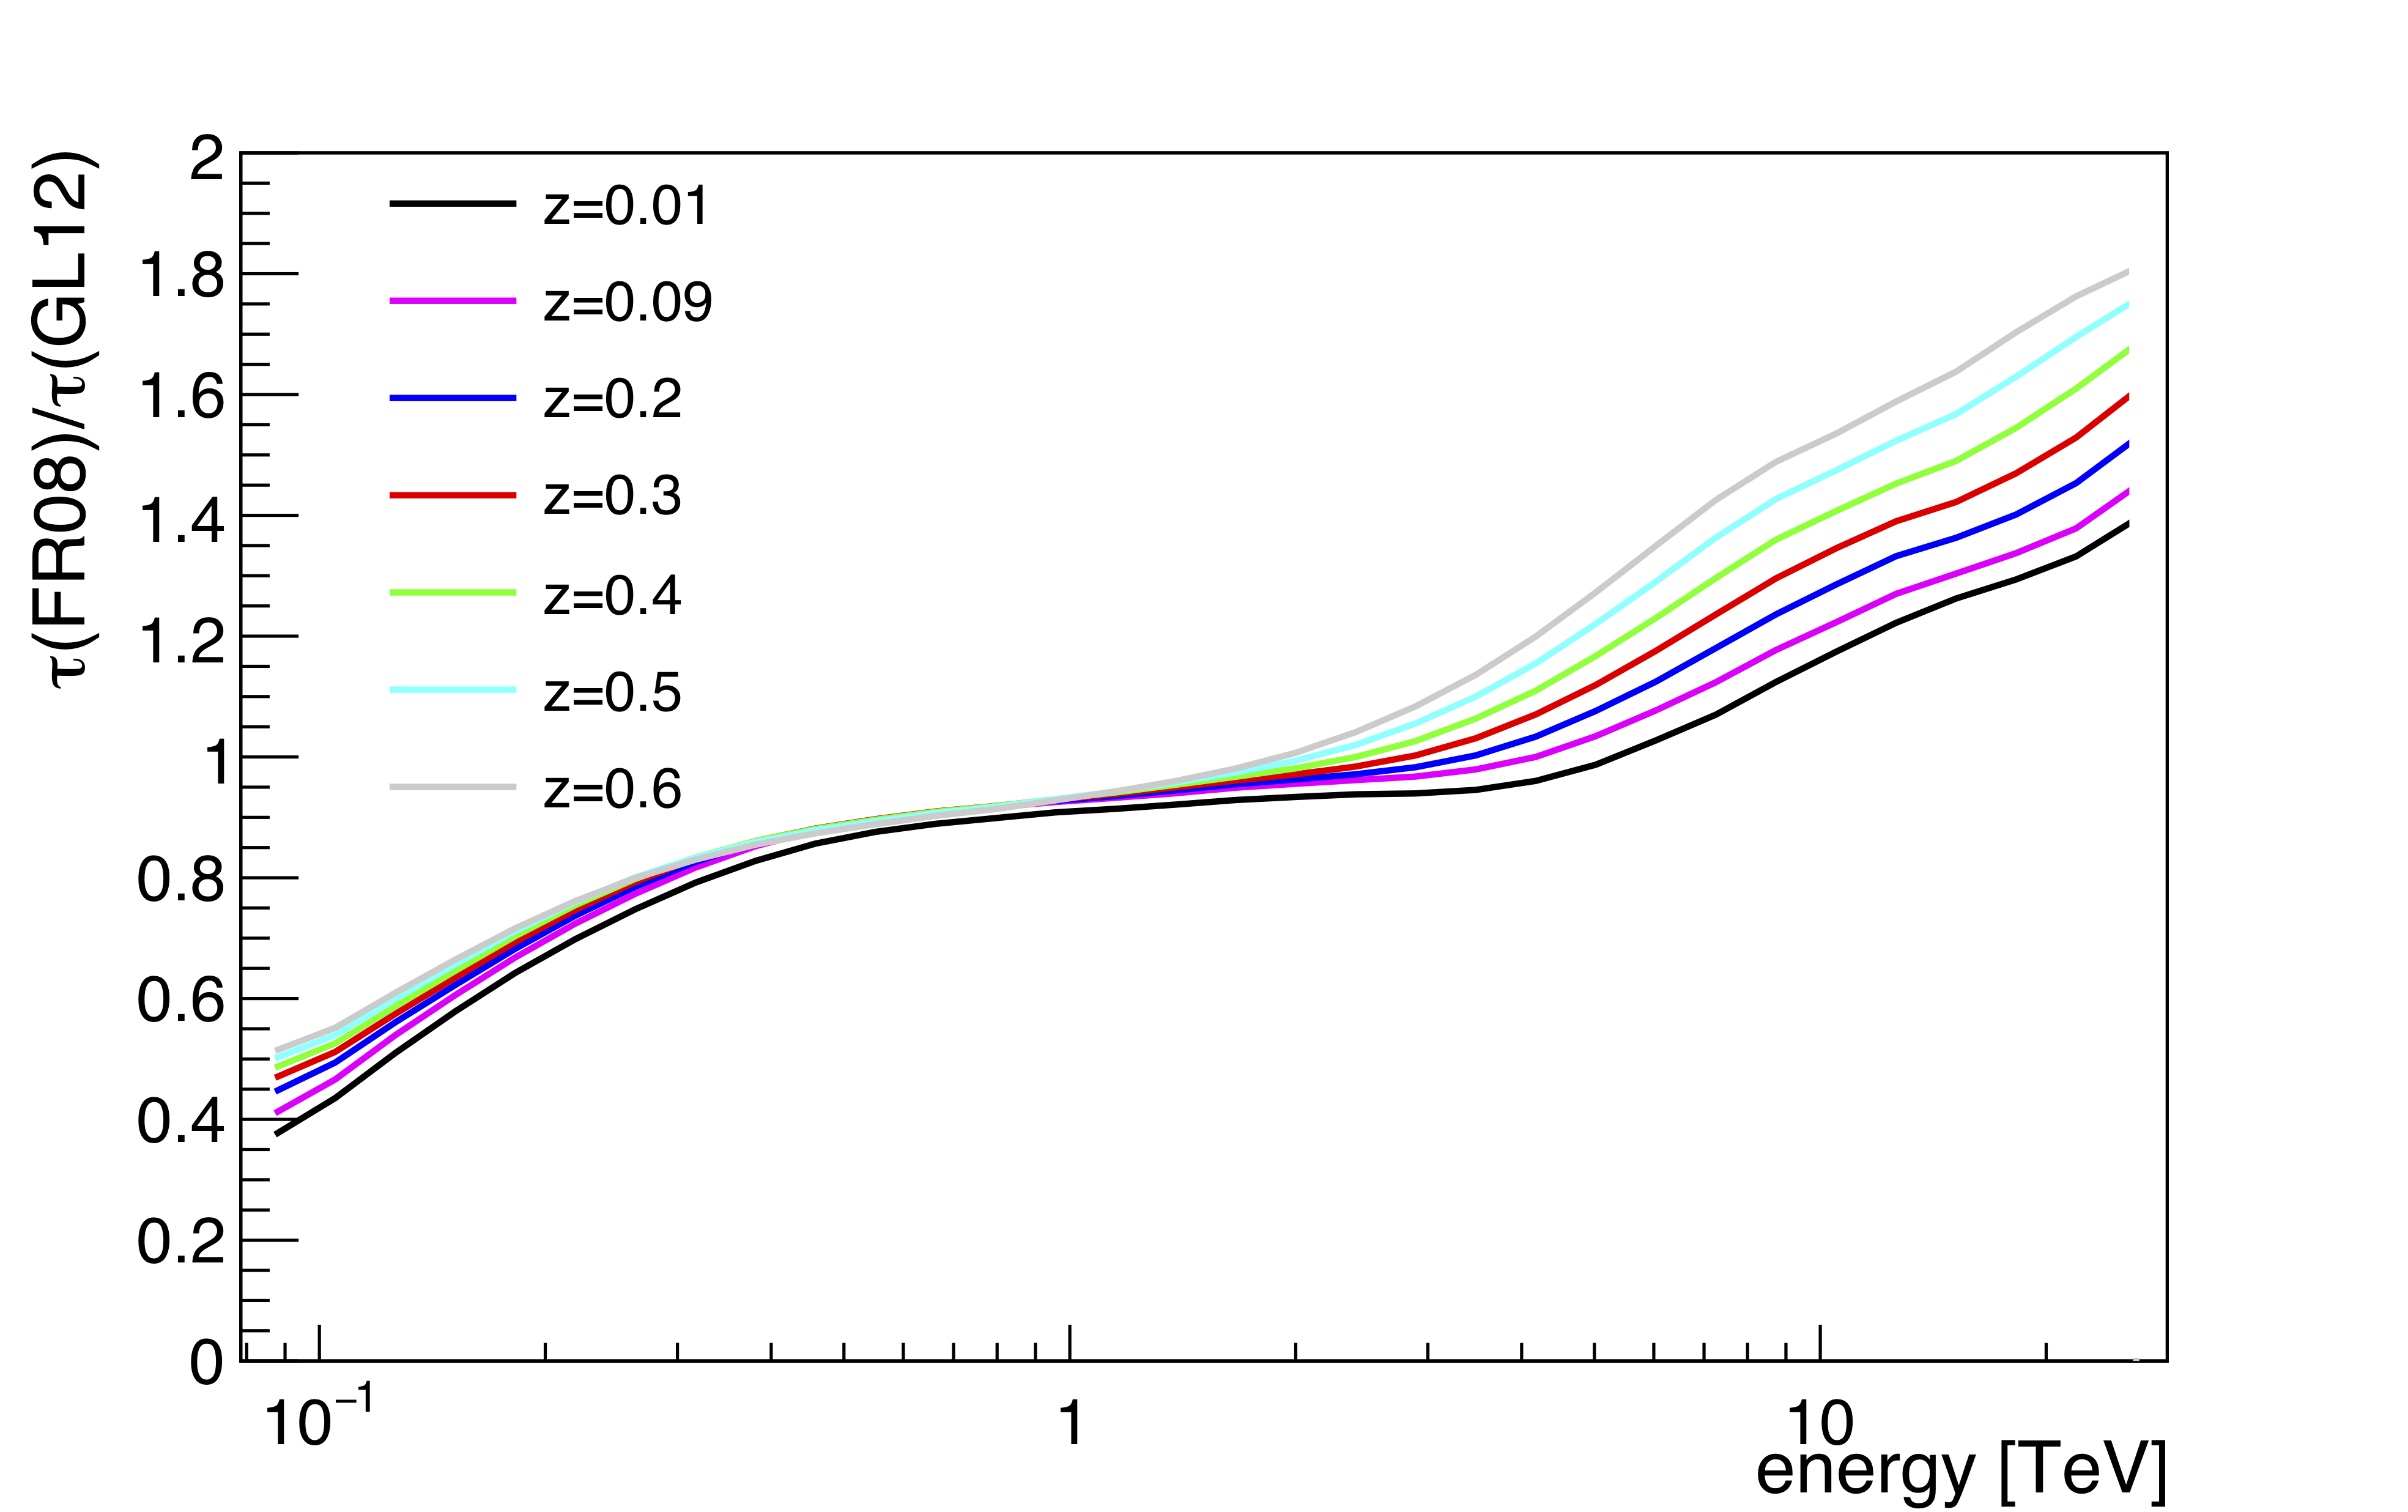
of blazar photon spectra. As photons from distant blazars travel to Earth, they interact with the EBL, resulting in pair production of electrons and positrons. This causes an energy- and distance-dependent attenuation of the photon flux arriving at Earth. With some assumptions about blazar intrinsic photon spectra and the evolution of the EBL density with distance, the observed spectra can be used to constrain the EBL spectral energy distribution (SED).
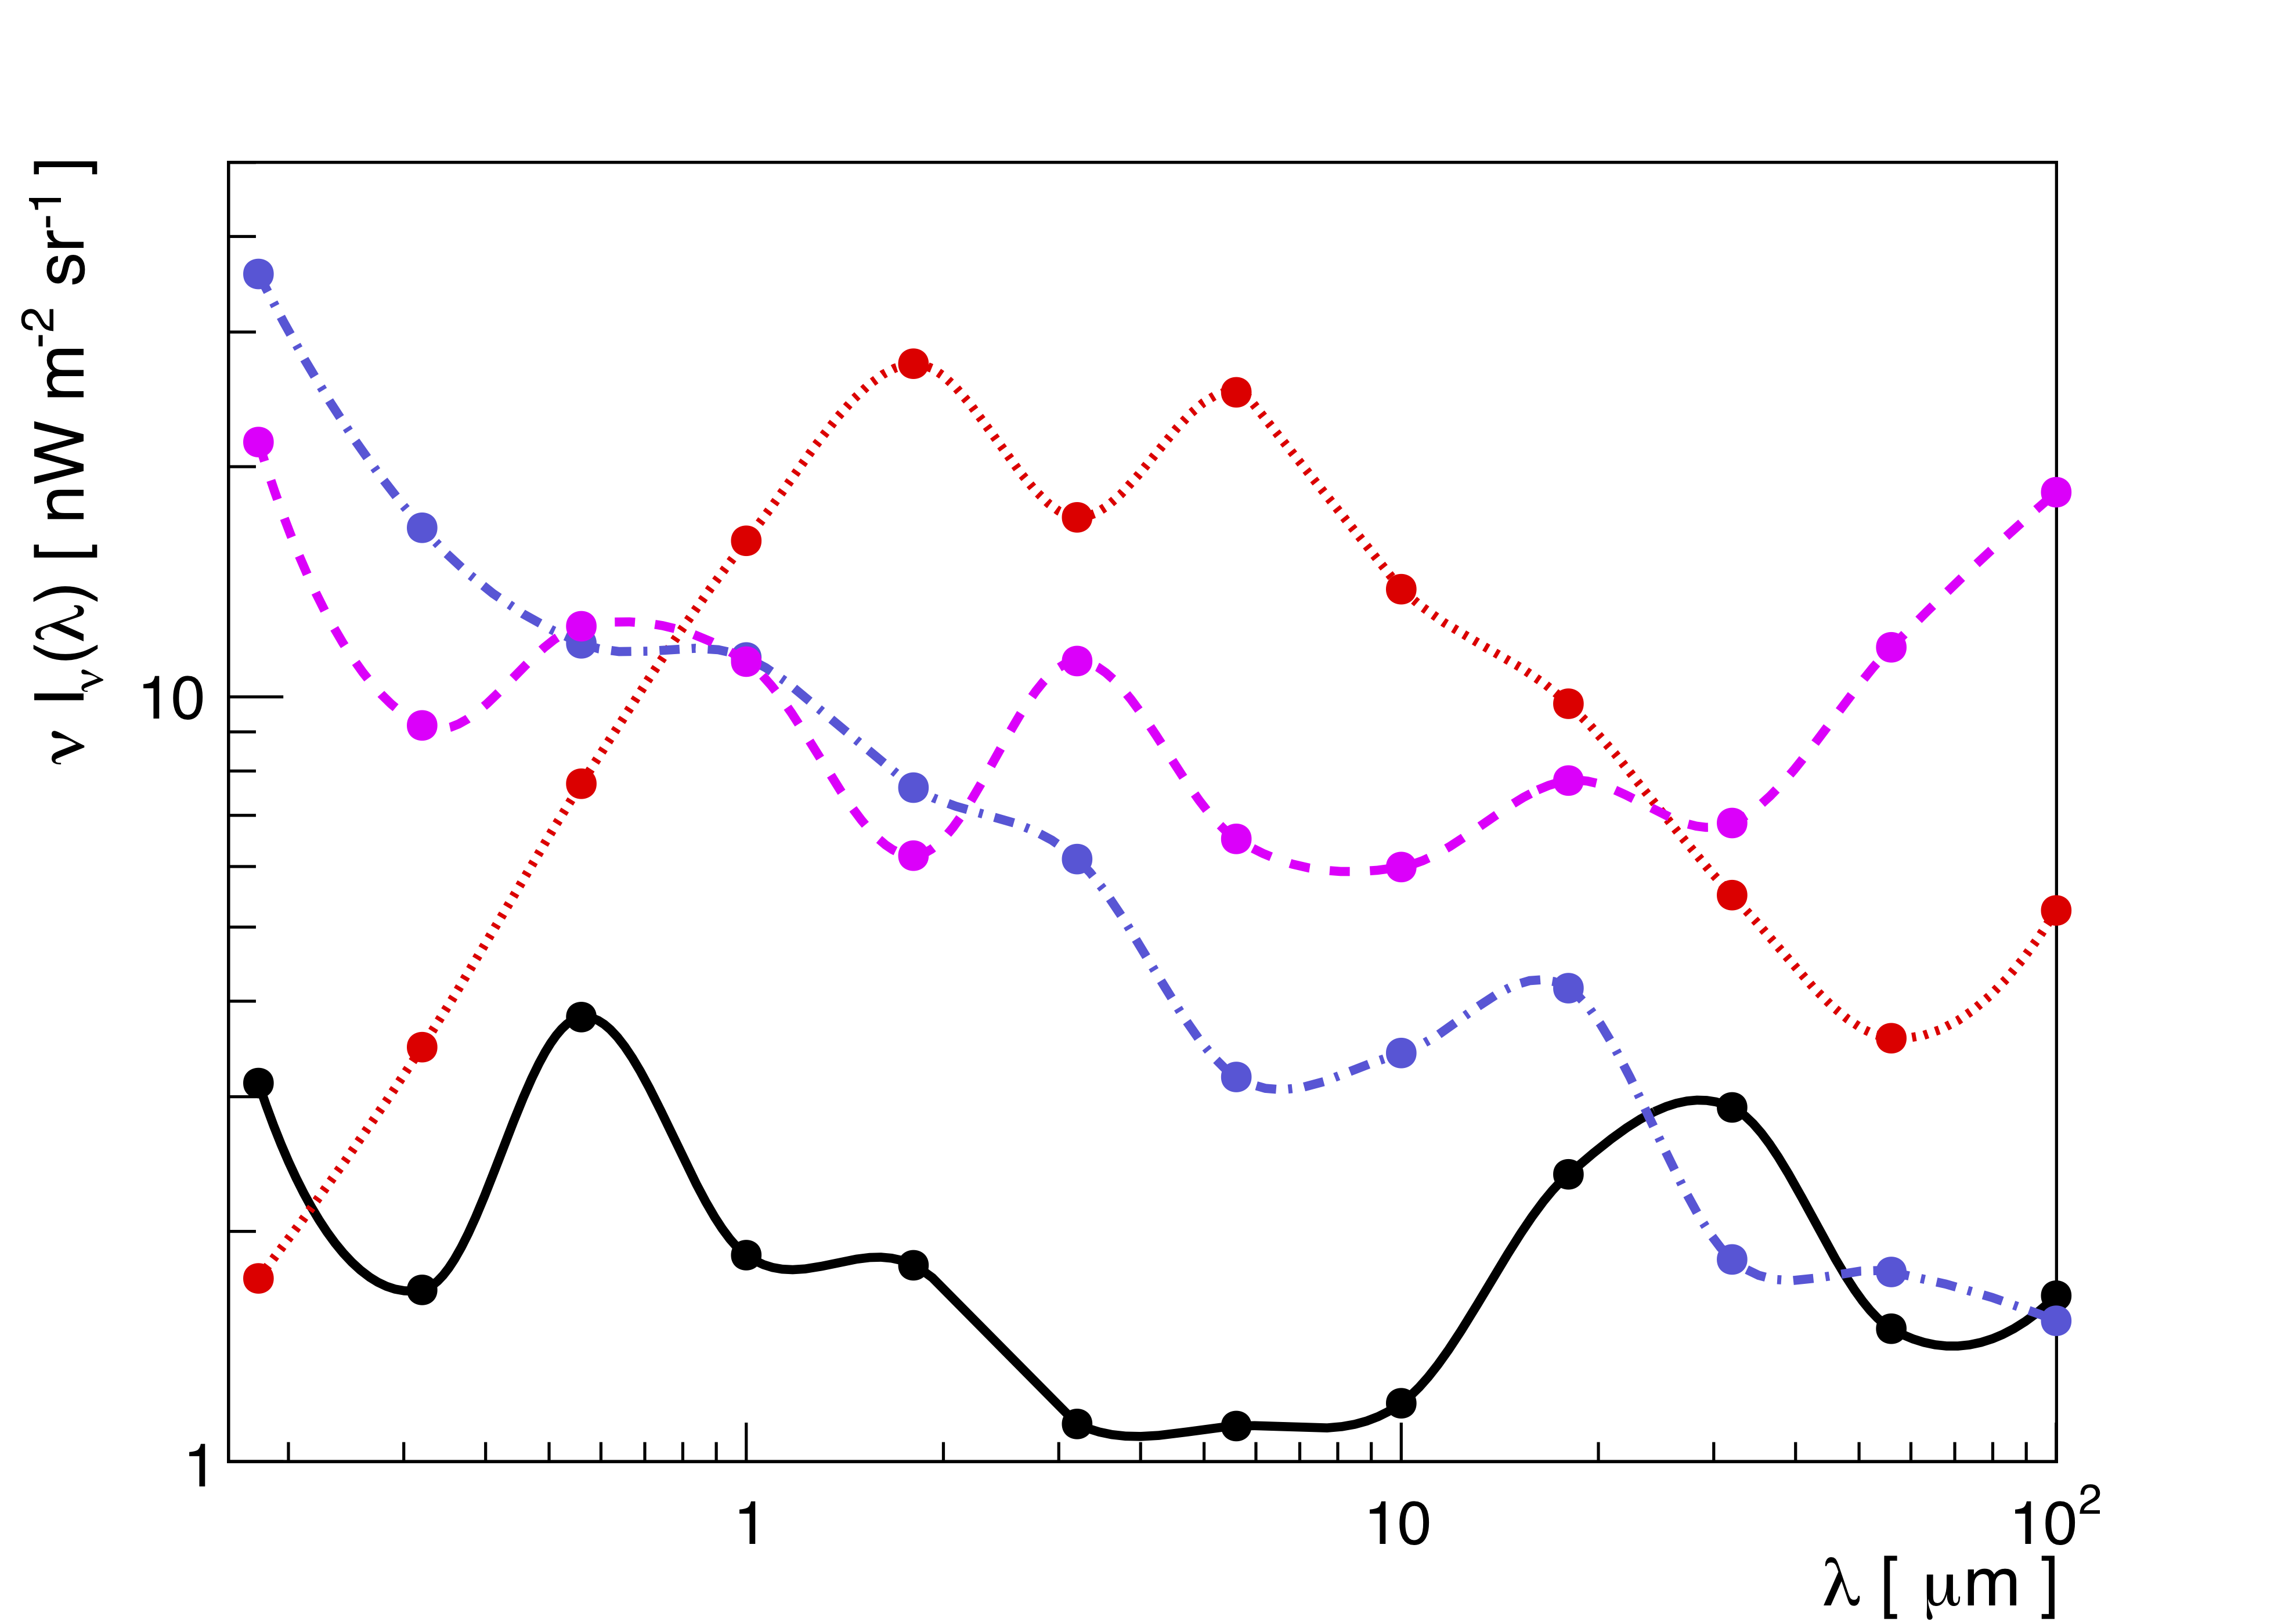
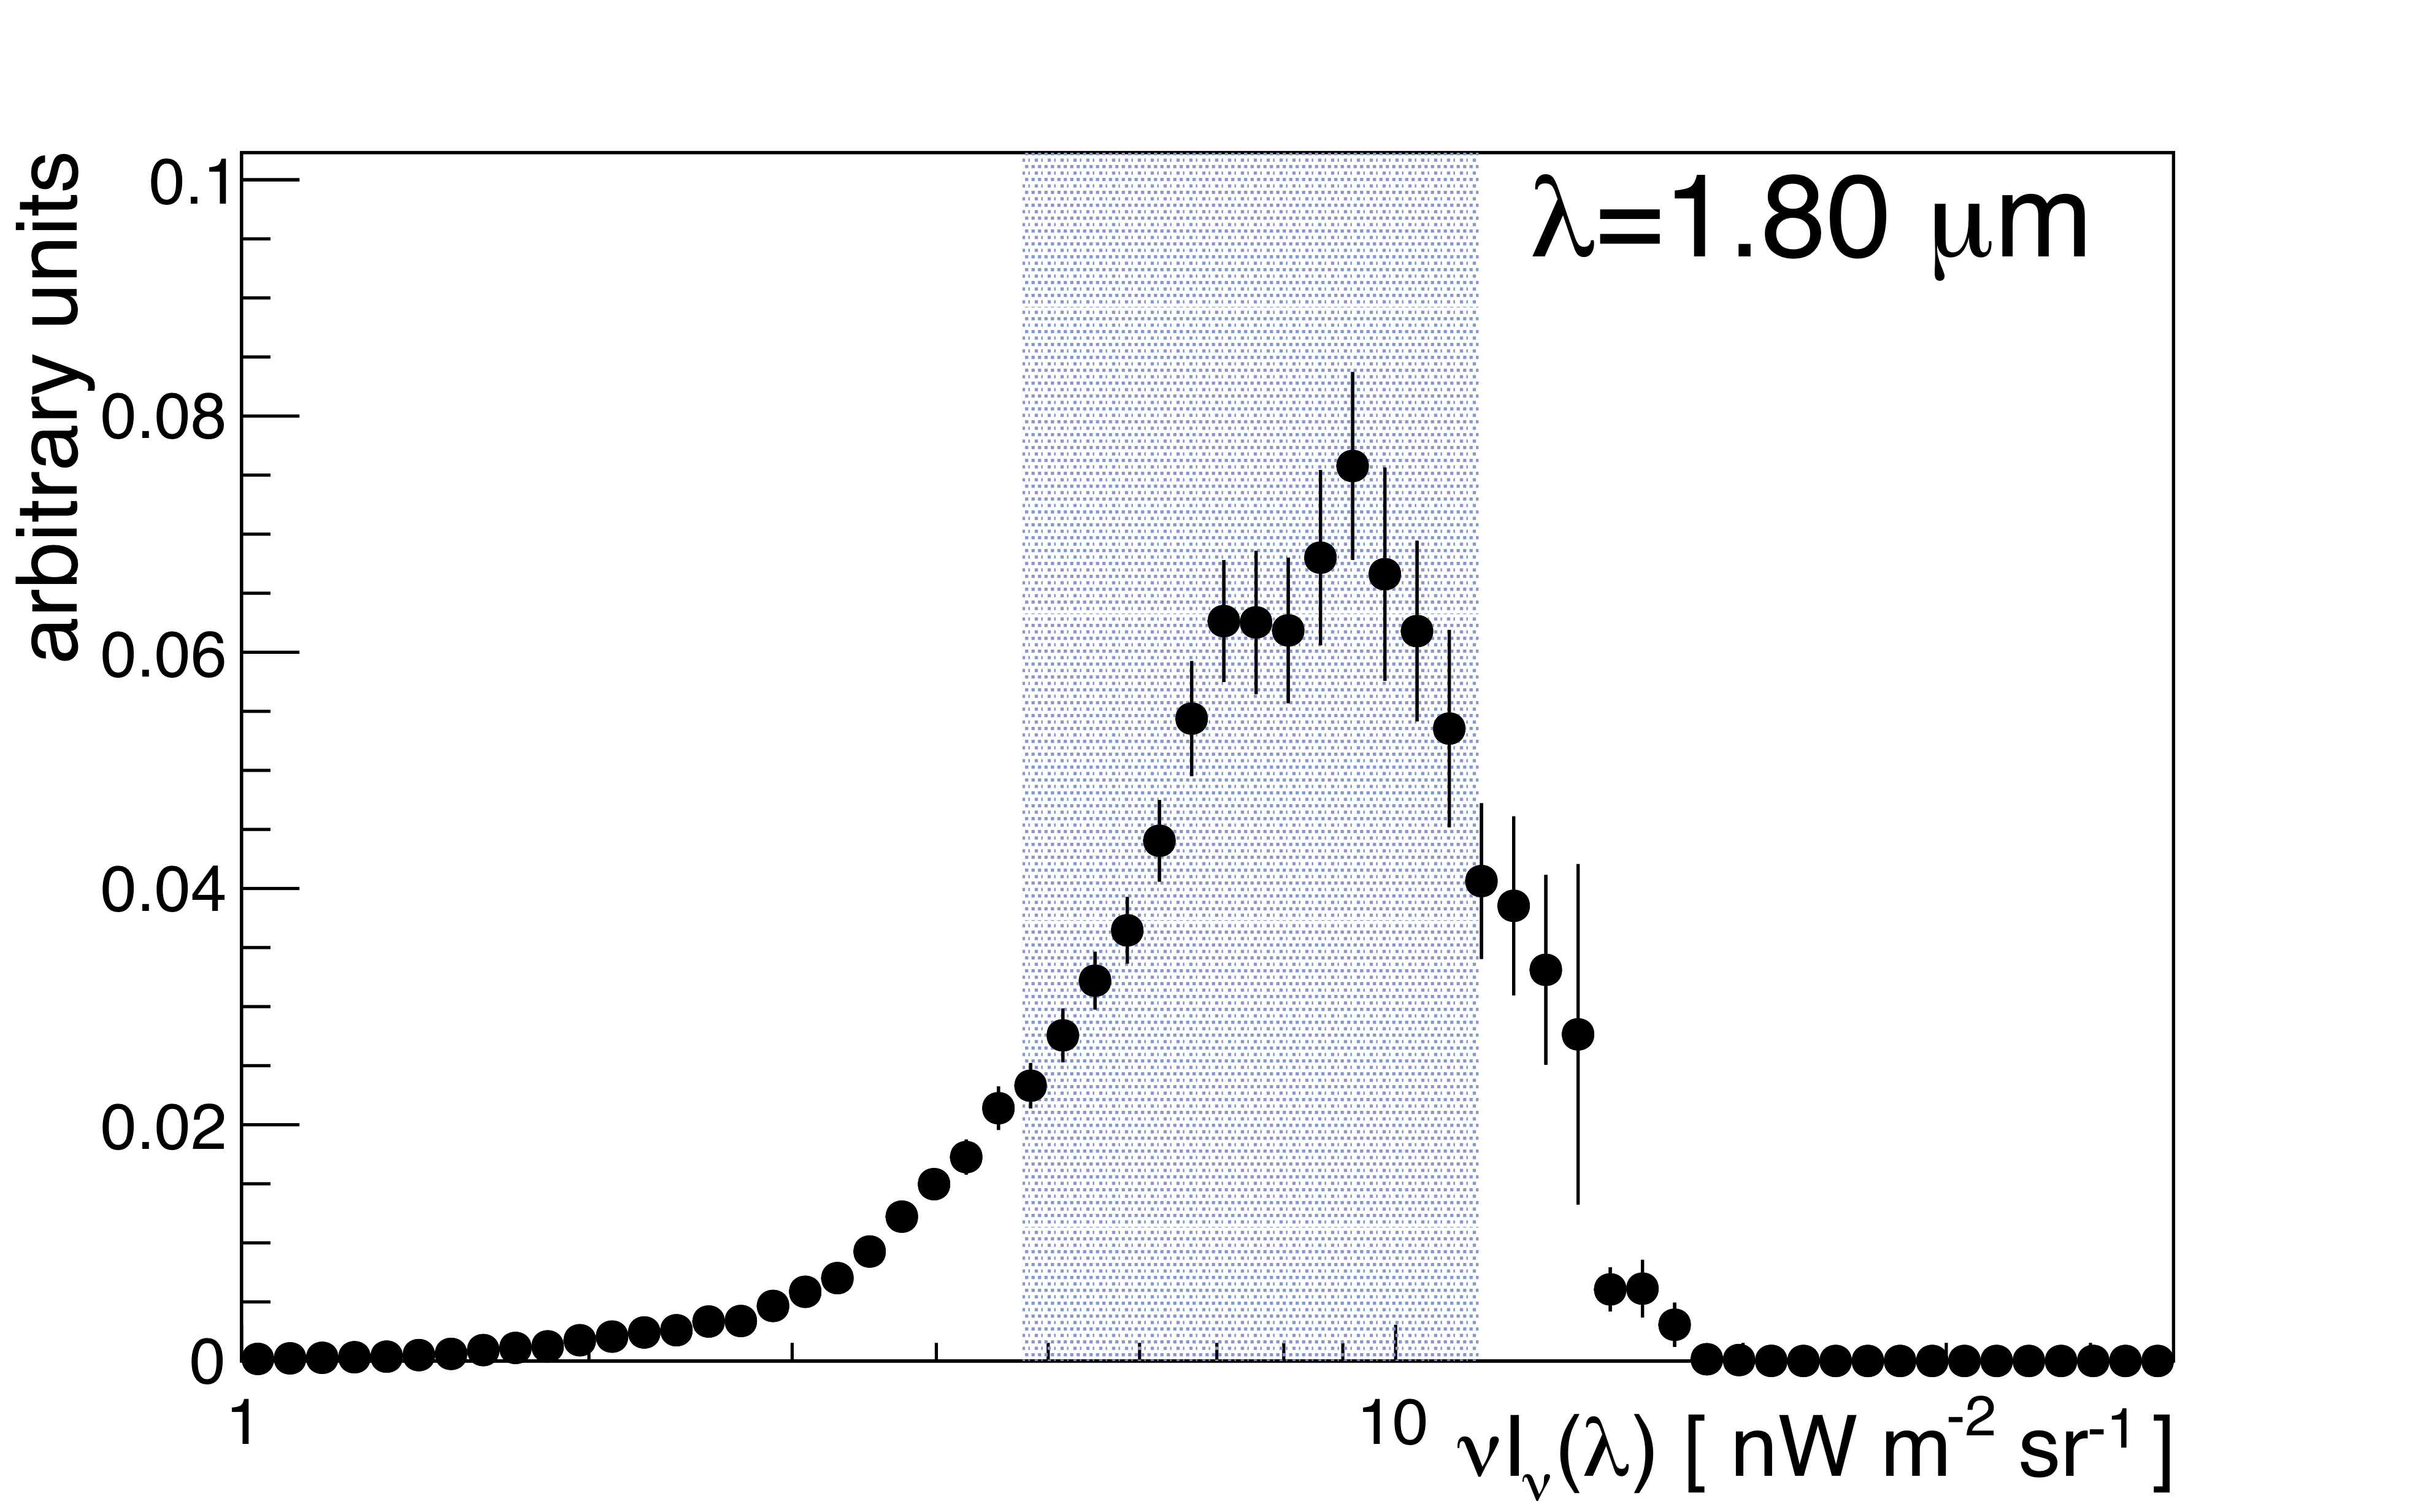
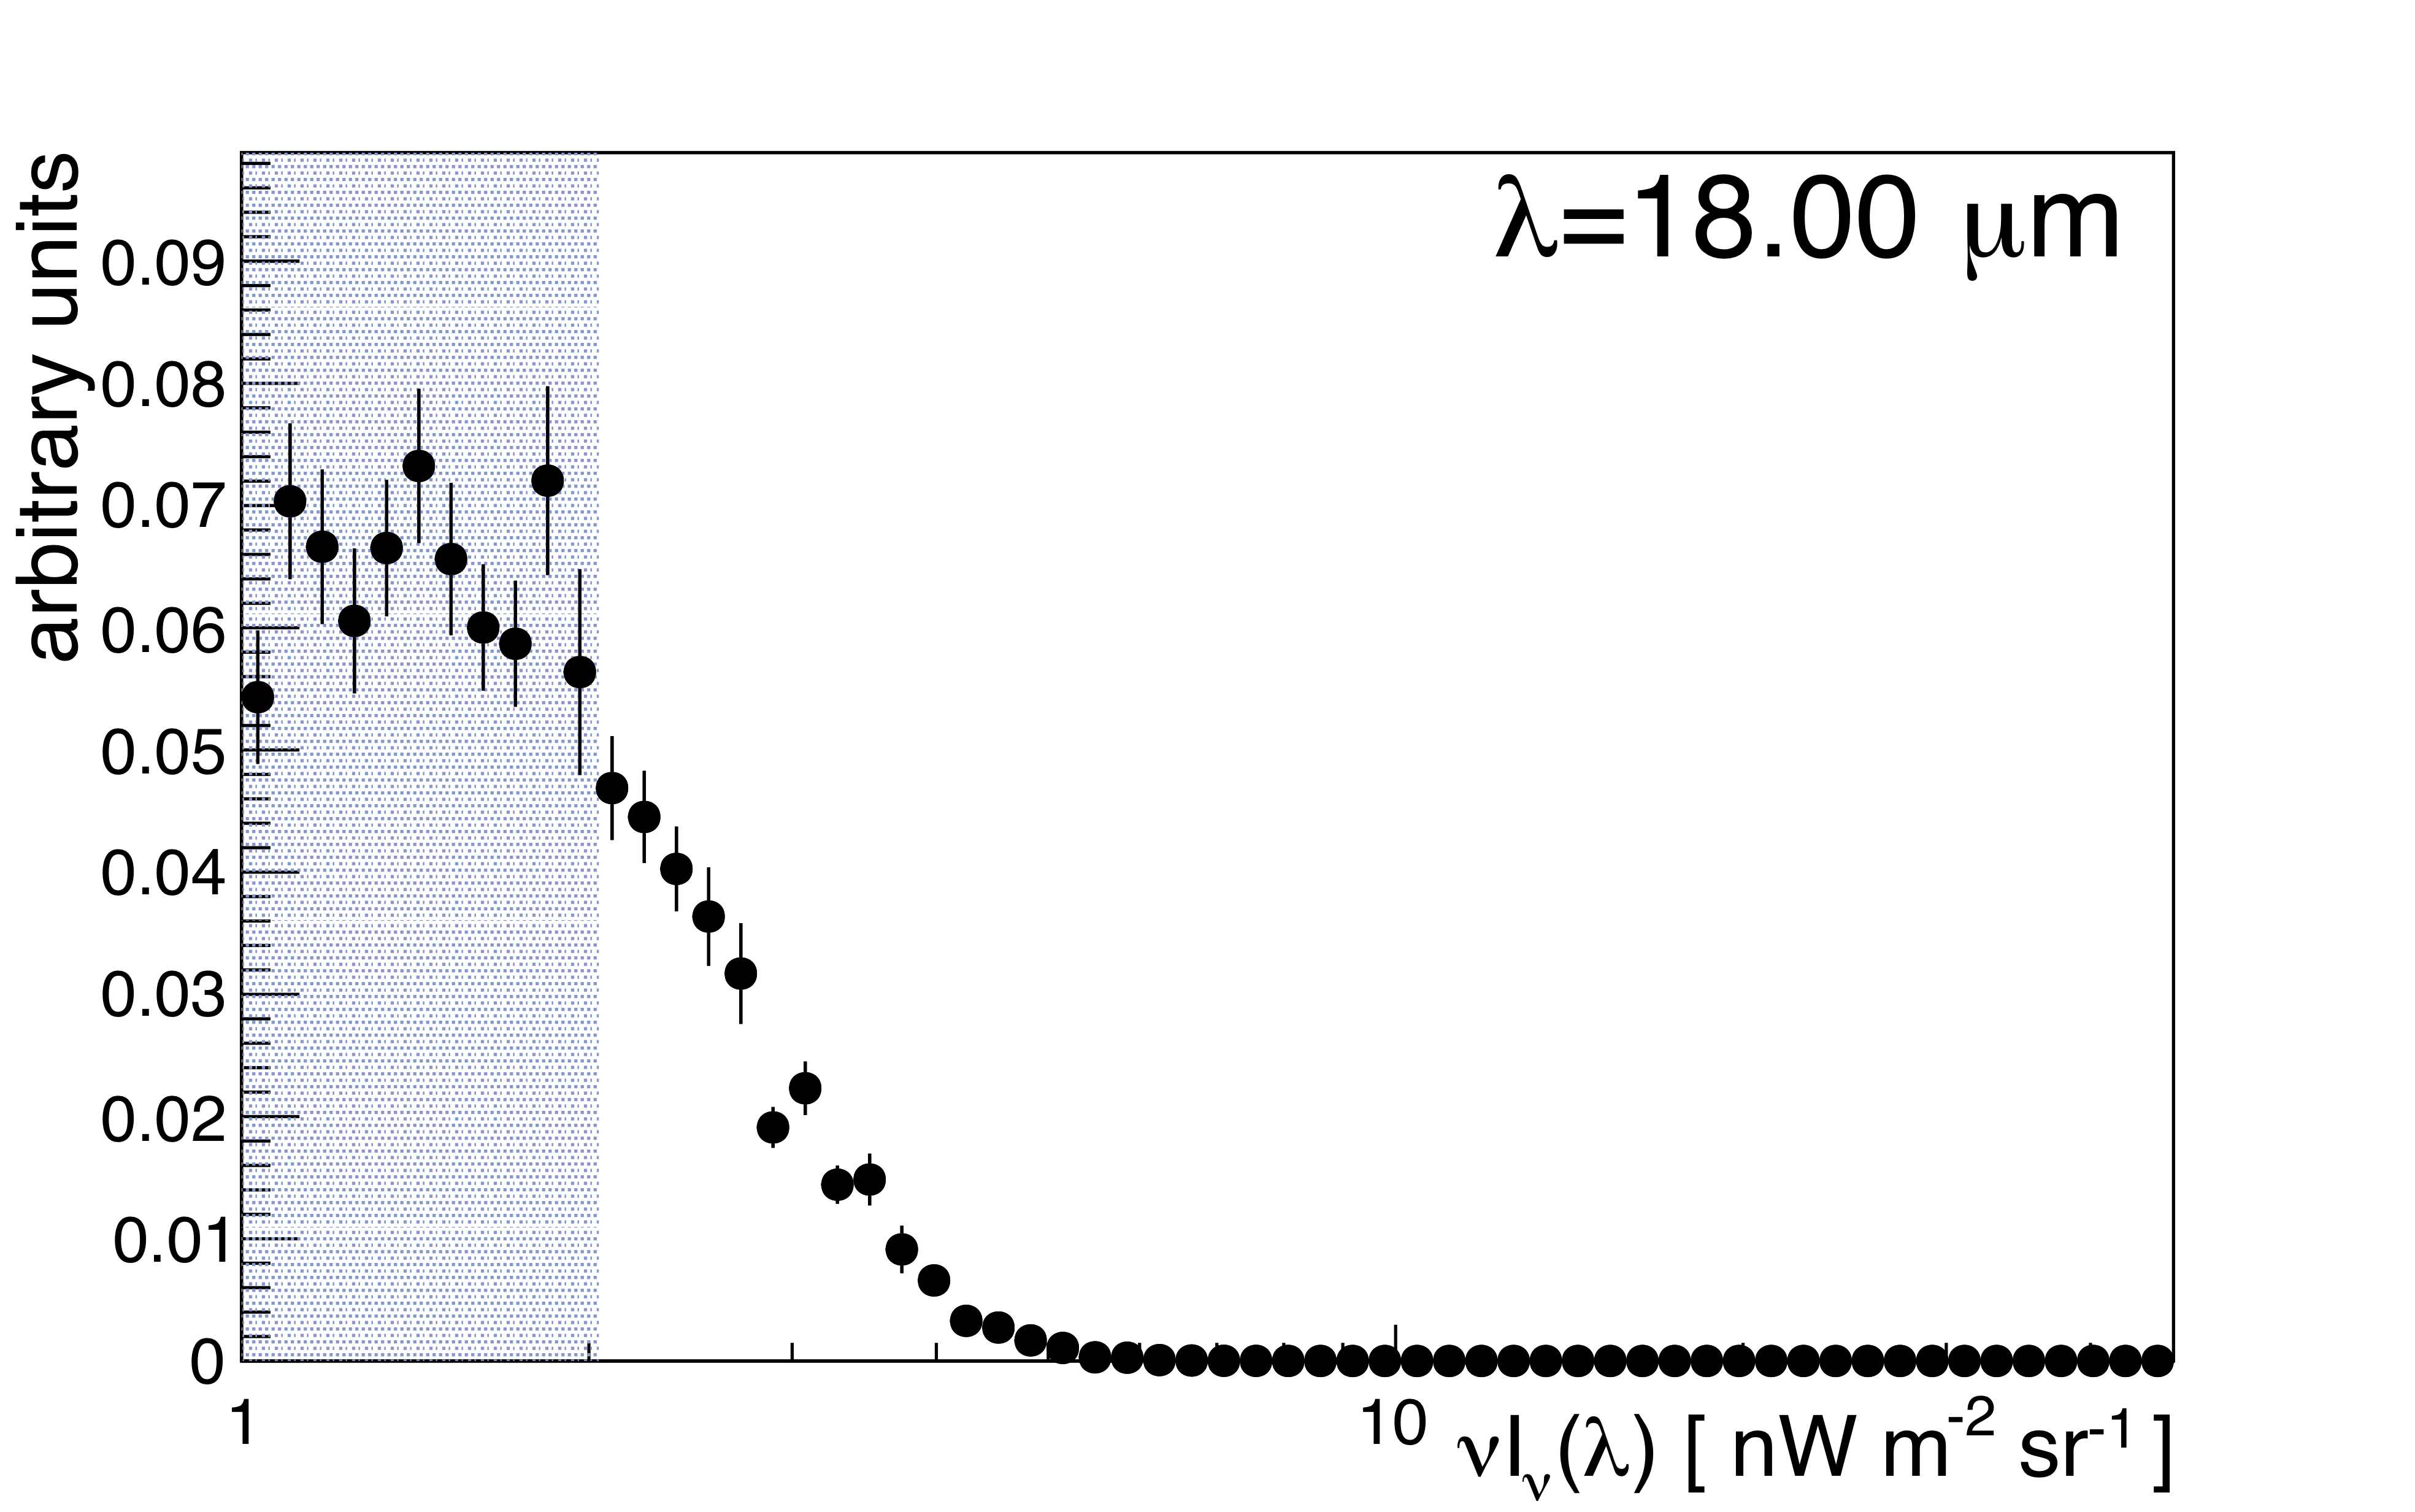
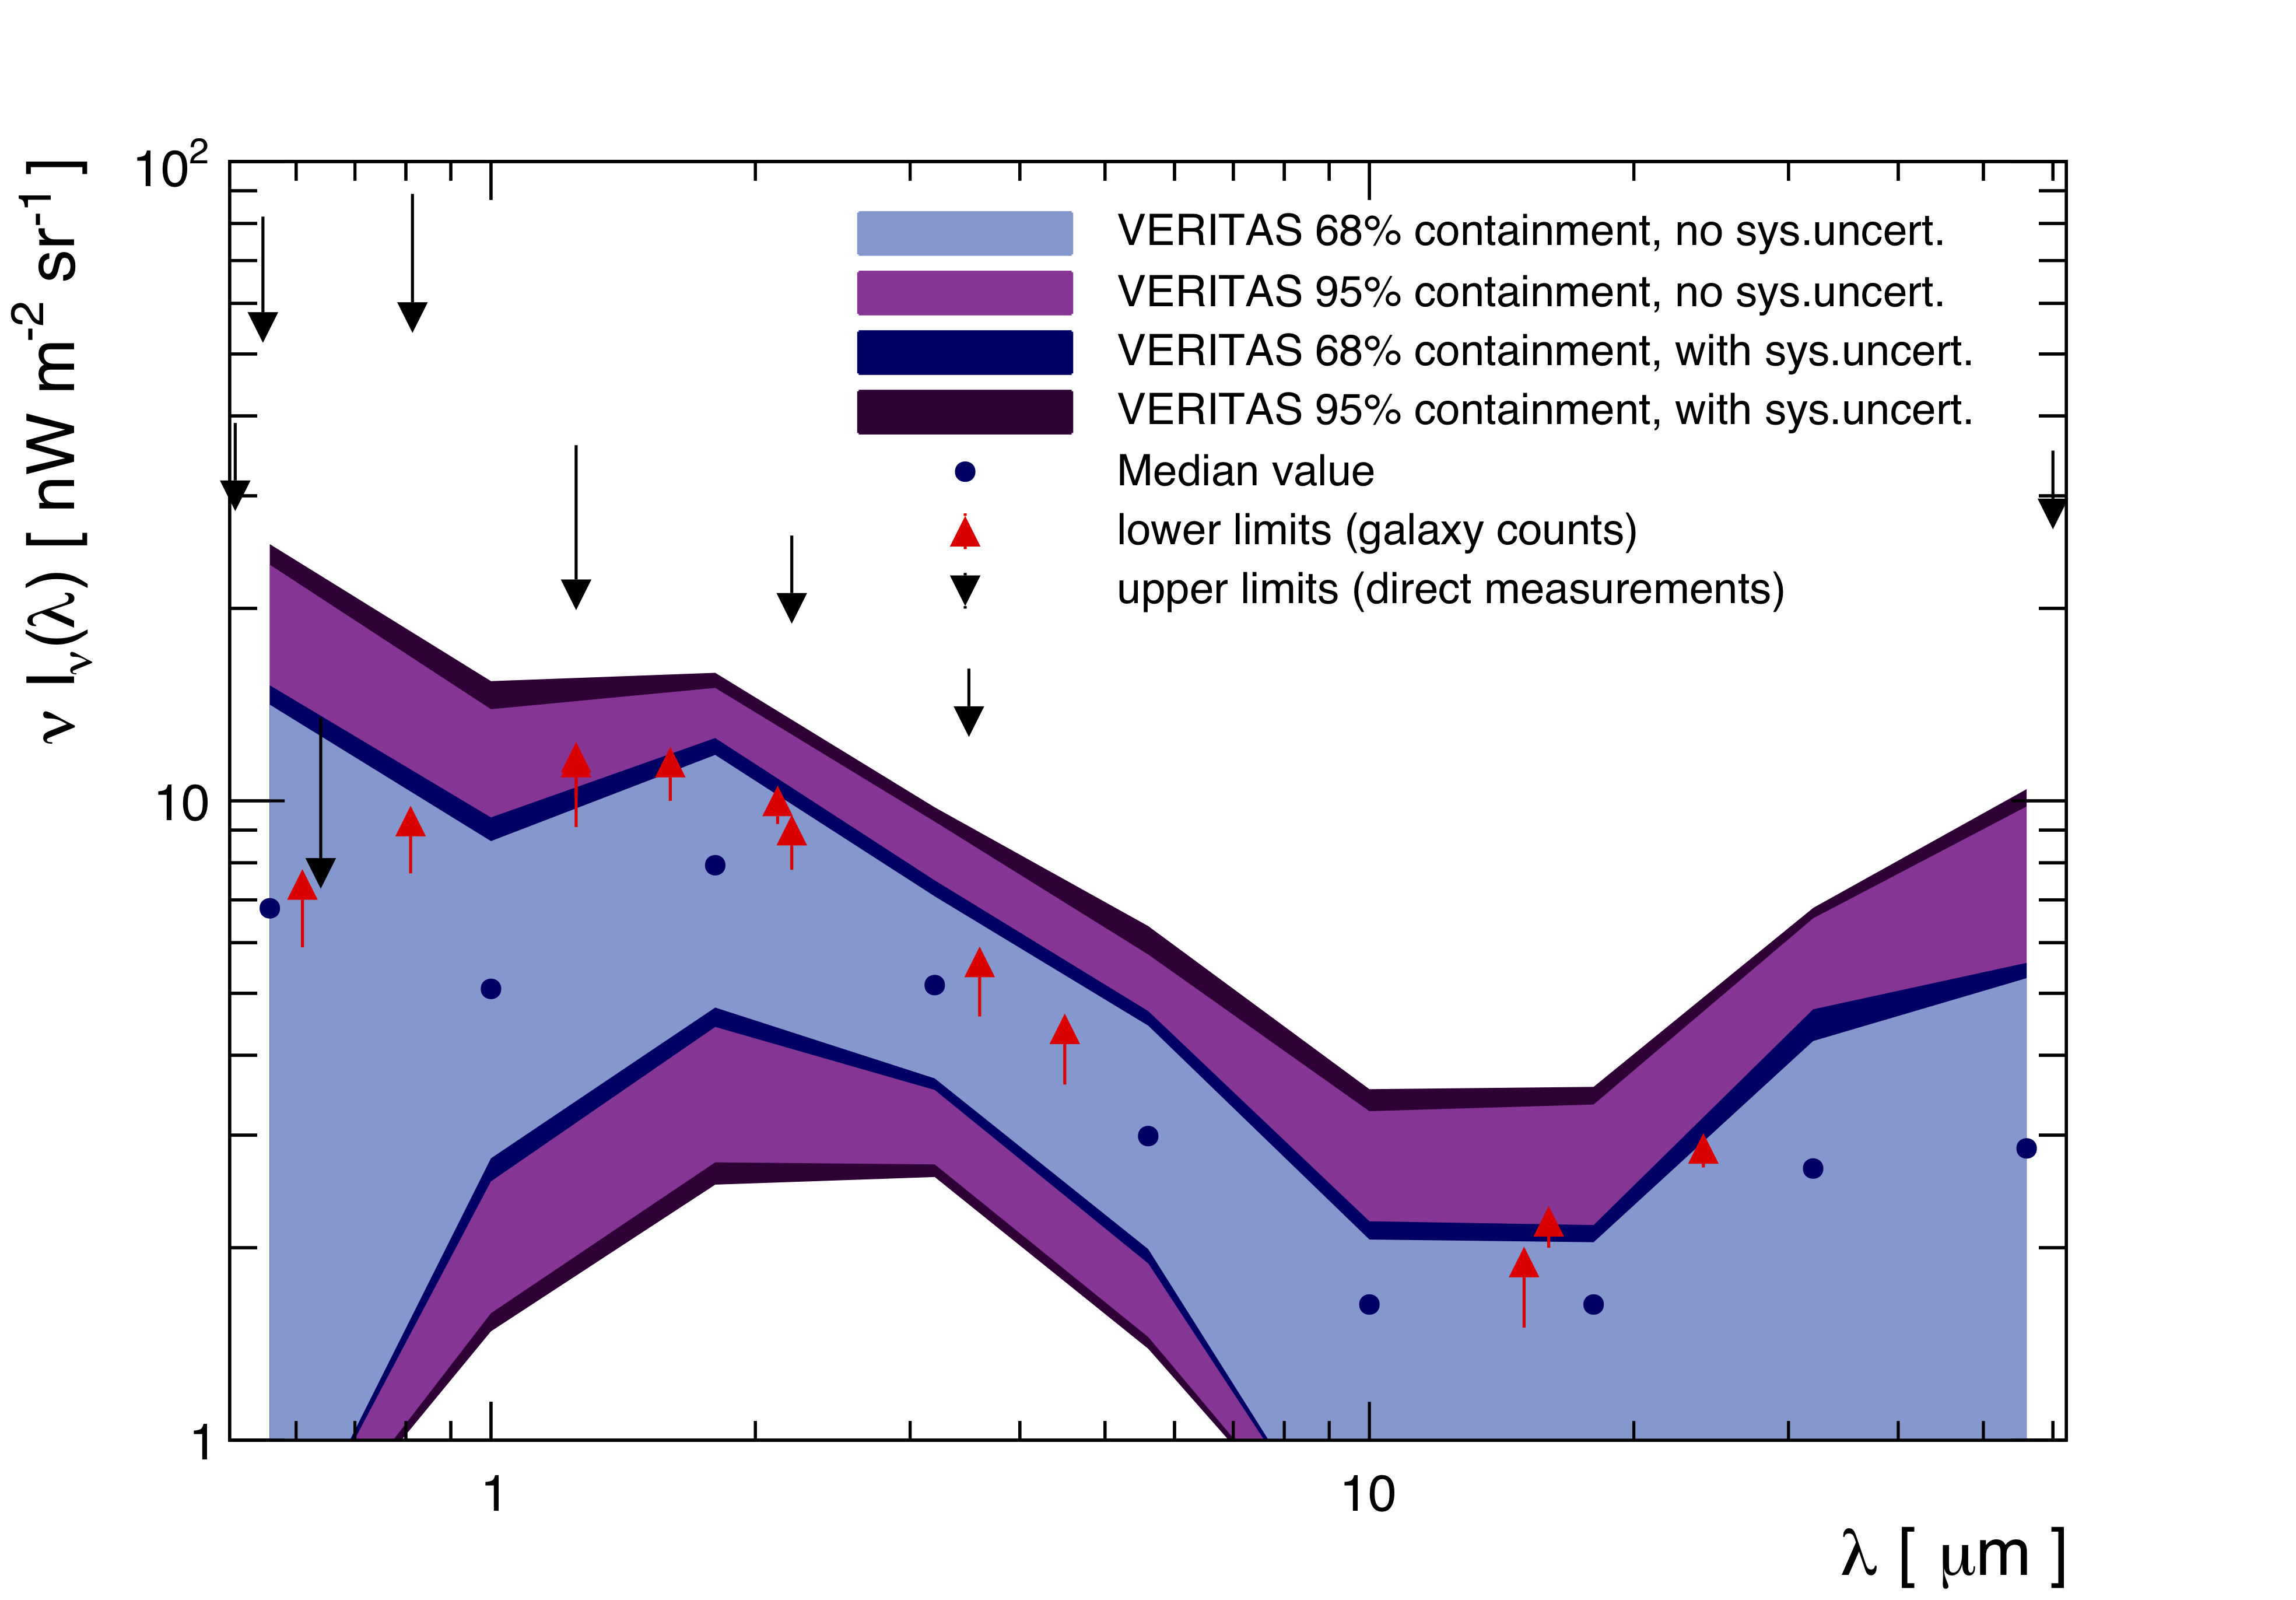
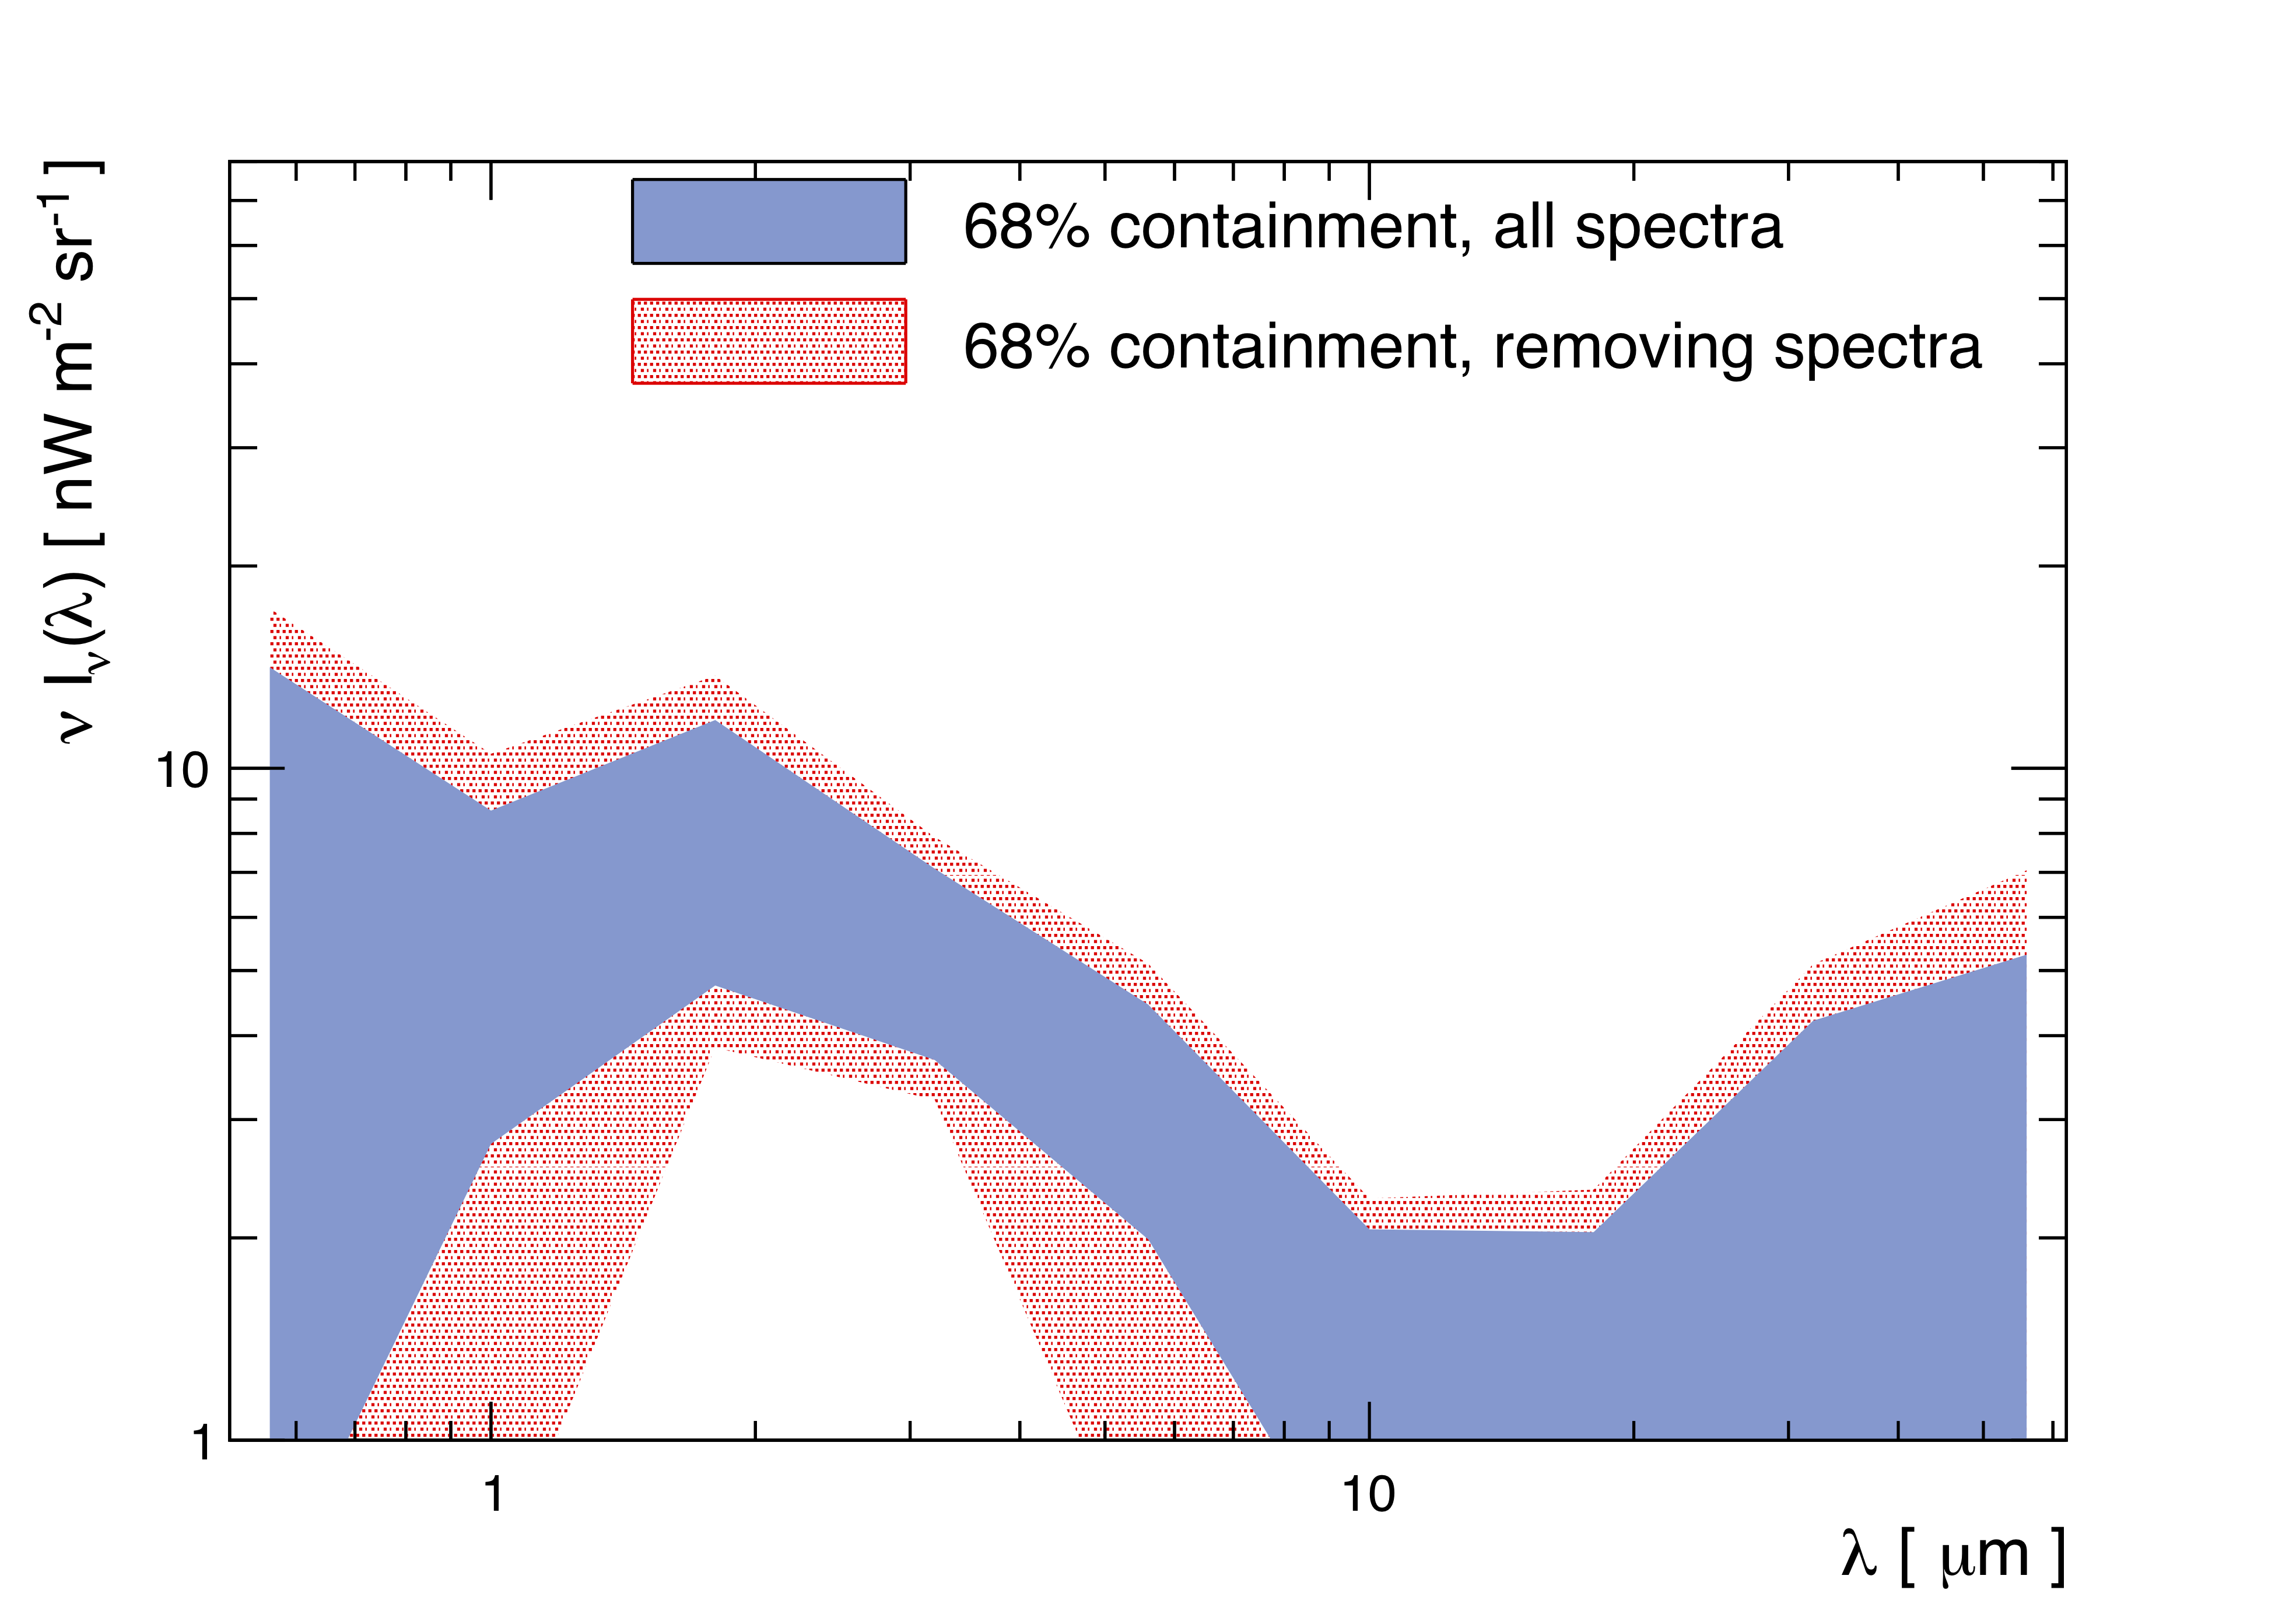
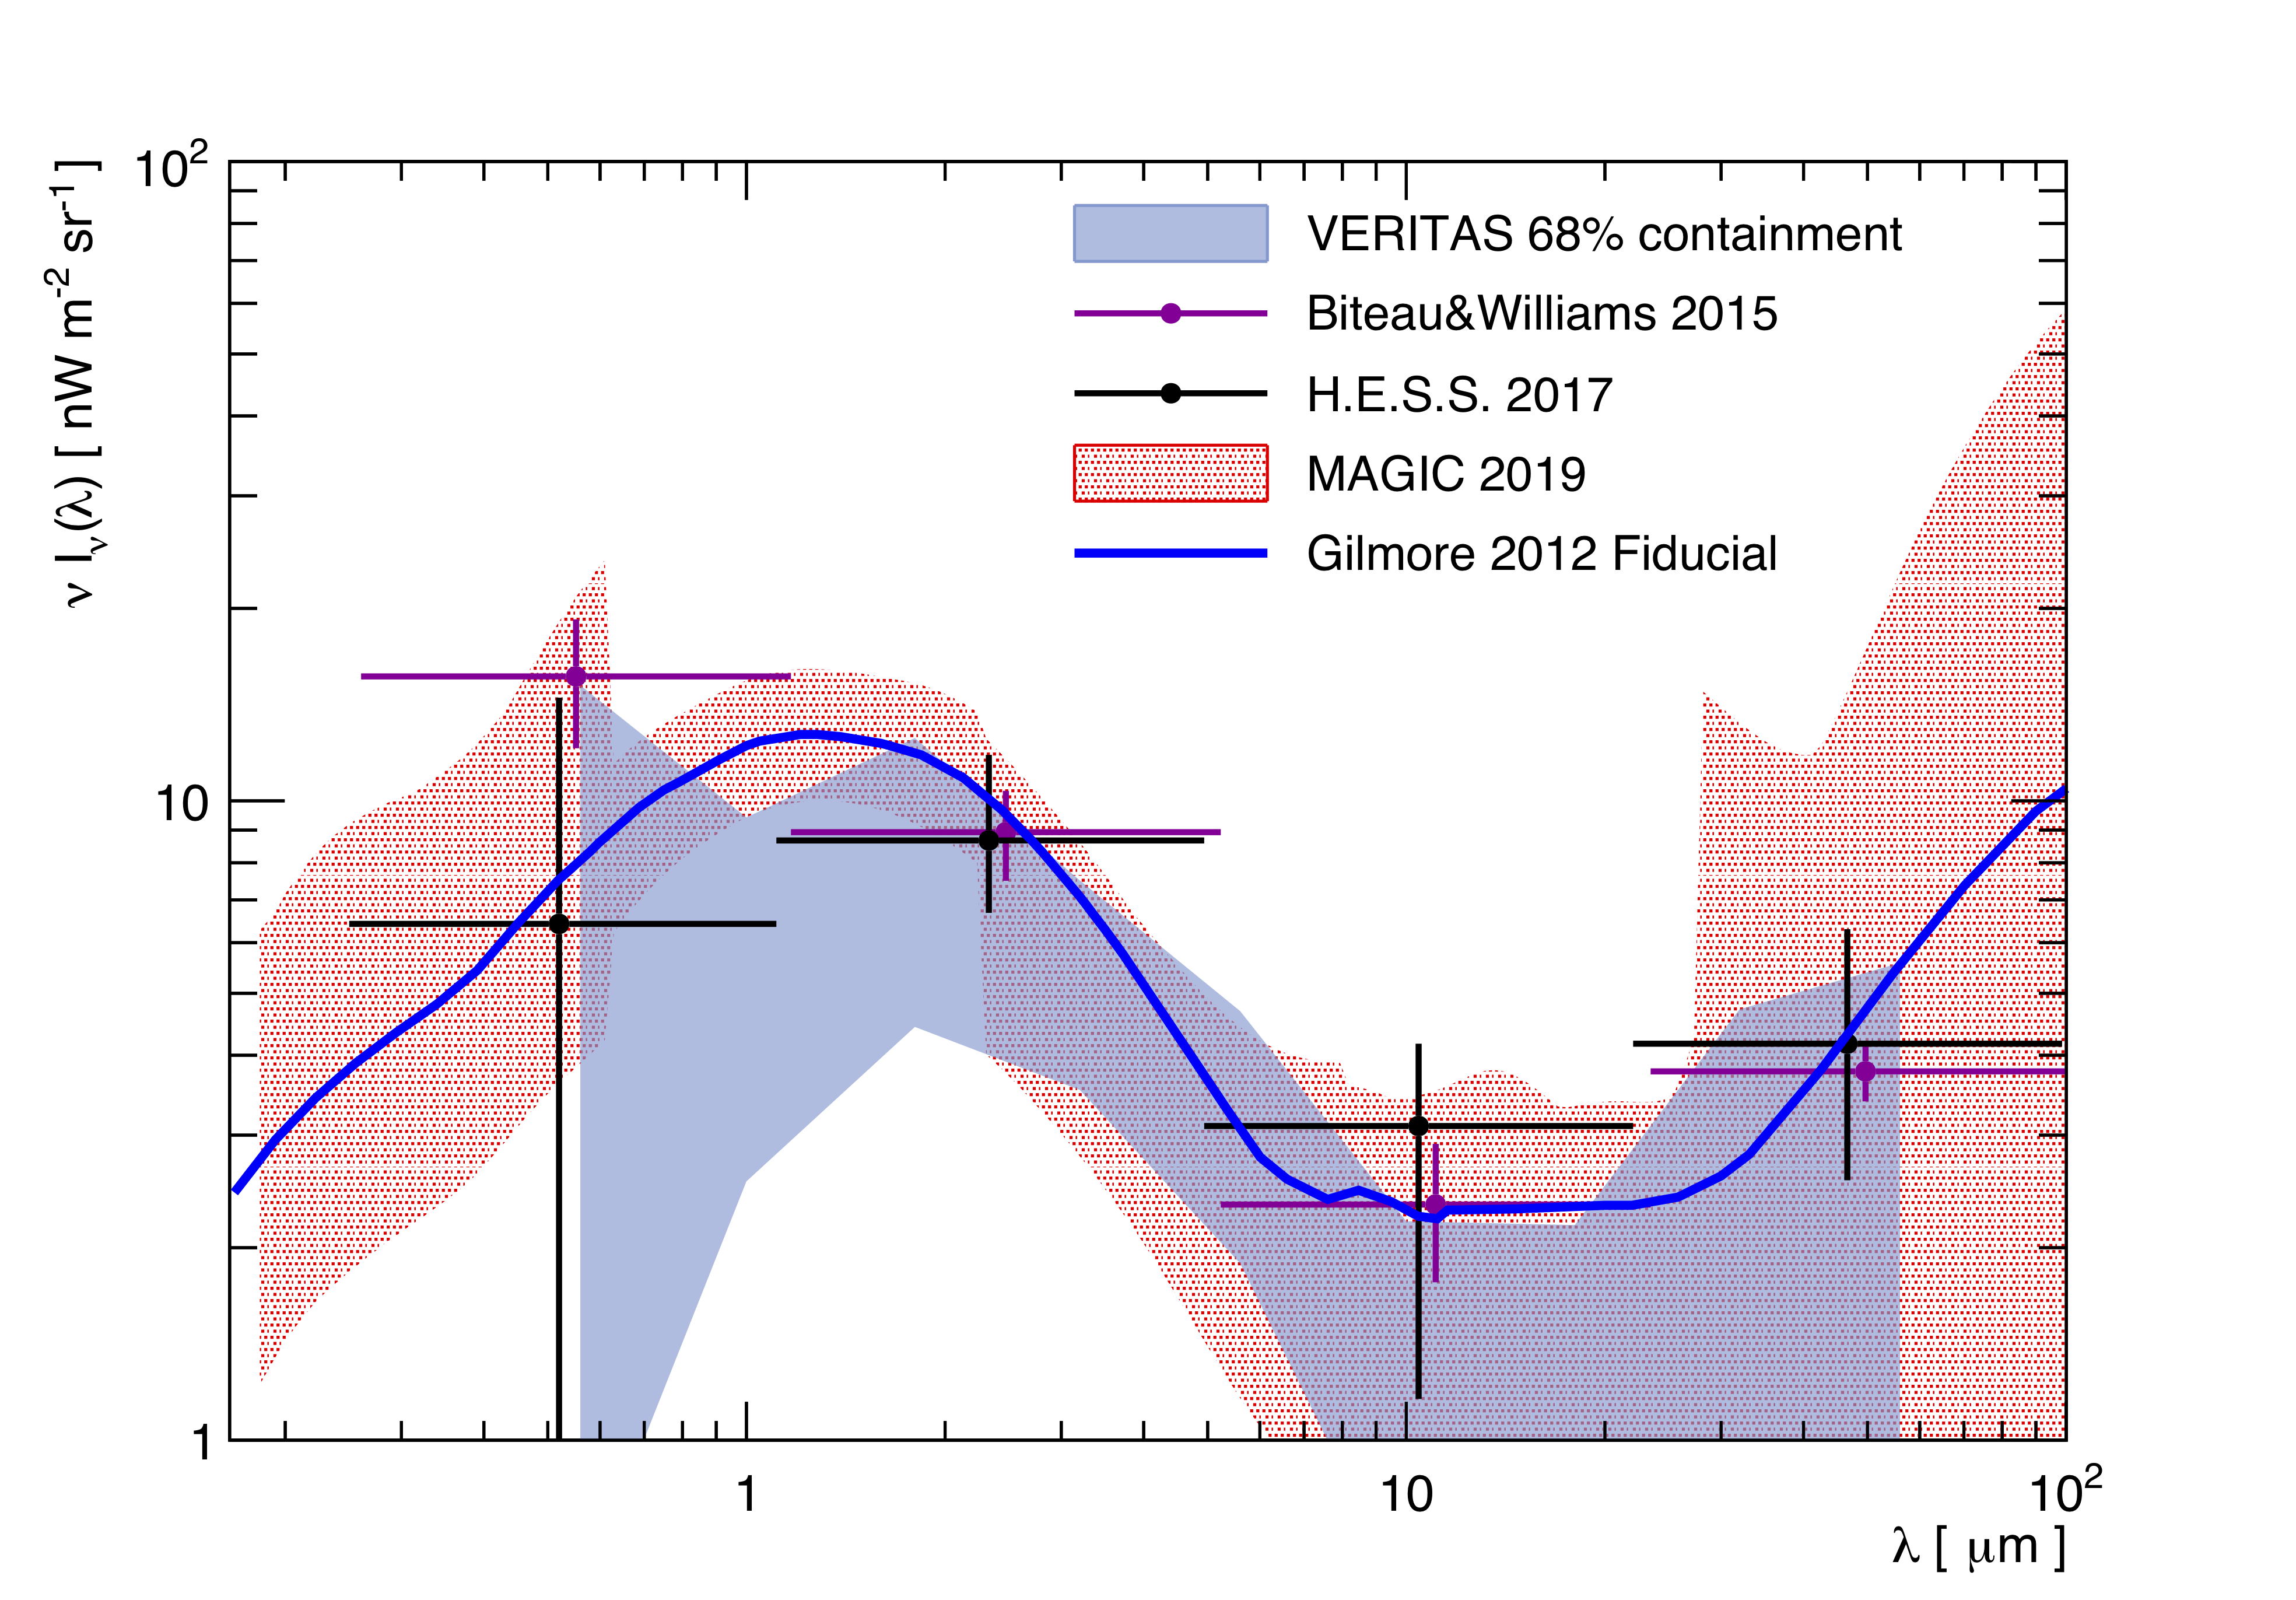
We present a measurement of the EBL SED in a wavelength range from 0.56 to 56 microns. The measurement is based on a spectral study of 14 blazars spanning 10 years of VERITAS observations. A set of minimal assumptions are made about the blazar intrinsic photon spectra, namely that they cannot have spectral upturns, and that there is a maximum hardness for the spectral index. The SED is in good agreement with lower limits on the EBL density, derived by summing the light from cataloged galaxies. Although the uncertainties are large, this measurement leaves a limited budget for additional components.
FITS files: N/A
Figures from paper (click to get full size image):