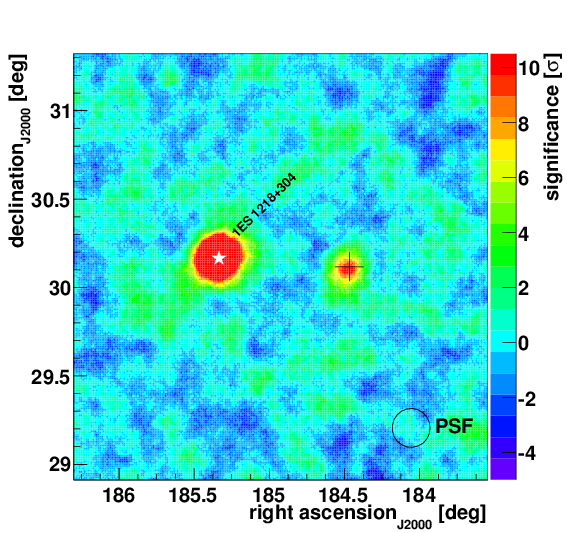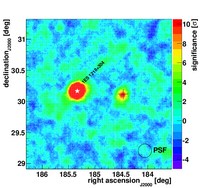
VERITAS significance sky map for 2011, showing the detection of B2 1215+30. See Figure 1 below for more details.
Reference: E. Aliu et al. (The VERITAS Collaboration), Astrophysical Journal 779: 92, 2013
In this paper, we report on VERITAS observations of the active galactic nucleus B2 1215+30 between 2008 and 2012. B2 1215+30 was one of the first BL Lac-type objects to be identified and was used, together with OJ 287, W Comae, AP Librae and BL Lacertae, to define the class [1].
At very high energies, B2 1215+30 was discovered by MAGIC in early 2011 following an optical high state [2]. As the source is in the same field of view as the well-known TeV-emitting blazar 1ES 1218+304, it has been regulary monitored by VERITAS since 2009. Up to 2012, VERITAS collected nearly 100 hours of observations on B2 1215+30. The analysis of this data set yielded a clear detection of 8.9 sigma significance and revealed long-term variability at energies above 200 GeV.
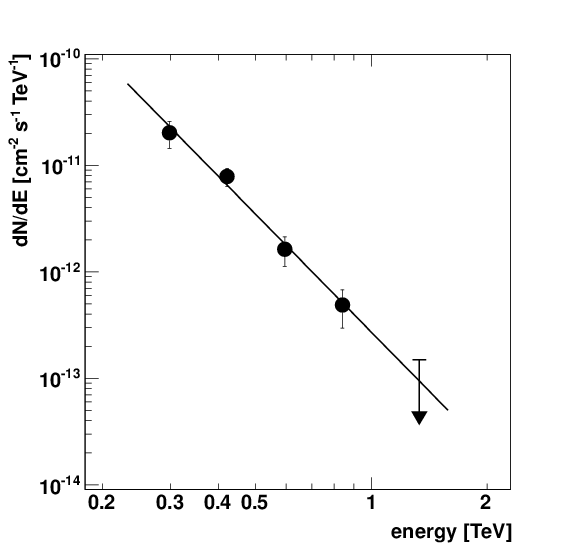
In 2011, the source entered a prolonged high state, during which no significant variability was detected in the VHE regime. The integral flux above 200 GeV corresponds to 3.4% of the Crab Nebula flux and the energy spectrum can be well described by a power law.
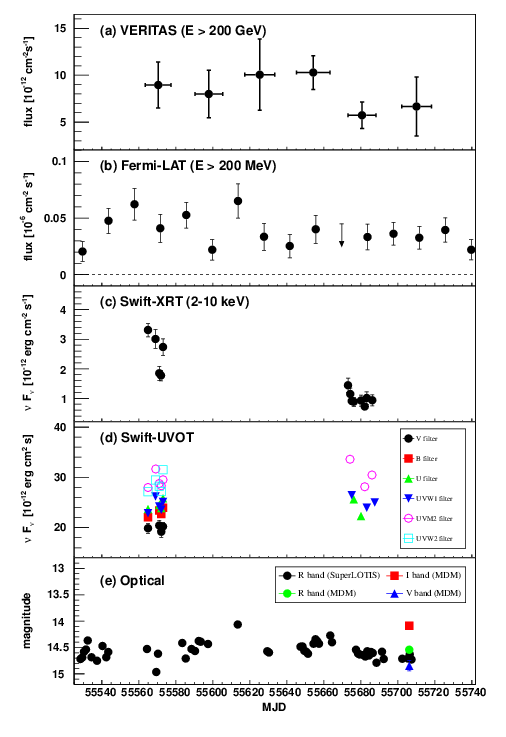
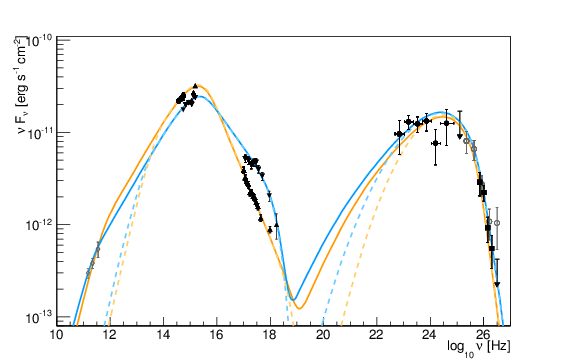
Multiwavelength (MWL) observations were obtained quasi-simultaneously with the VERITAS observations in 2011, covering optical (Super-LOTIS, MDM, Swift-UVOT), X-ray (Swift-XRT) and gamma-ray (Fermi-LAT) frequencies. These observations were used to construct the spectral energy distribution of B2 1215+30 which can be successfully modeled with a one-zone synchrotron self-Compton model. Through a comparative study with other blazars detected by VERITAS, we could show that most of the parameter values used to model the broadband emission of B2 1215+30 are in the range of other VERITAS-detected blazars, making this blazar a typical very-high-energy gamma-ray emitter.
[1] P.A. Strittmatter, K. Serkowski, R. Carswell et al., ApJL 175, L7 (1972).
[2] J. Aleksic, E.A. Alvarez, L.A. Antonelli et al., A&A, 544, A142 (2012).
FITS files:
Figures from paper (click to get full size image):
Figure 1: VERITAS significance sky map of 2011. The black cross shows the position of B2 1215+30 and the white star indicates the position of 1ES 1218+304. Both sources are point-like, but appear to have a different size due to the saturation of the color scale.
Figure 2: Differential photon spectrum of B2 1215+30 obtained with VERITAS in 2011. The spectral points are fitted with a power-law. The error bars denote 1σ uncertainties, and an 95% upper limit is drawn for a spectral point with less then 2σ significance.
Figure 3: Multi-wavelength light curve of B2 1215+30 for the first half of 2011. (a) Monthly binned VHE gamma-ray light curve above 200 GeV as measured by VERITAS. (b) Bi-weekly binned Fermi-LAT light curve above 200 MeV. (c) X-ray light curve measured by Swift-XRT. (d) Swift-UVOT light curve for the different filters (given in the legend). (e) Optical light curve. The black points are measured by Super-LOTIS in the R-band, with a statistical error of ~ 0.1 . 0.2 mag. The V, R, and I points are from MDM observations.
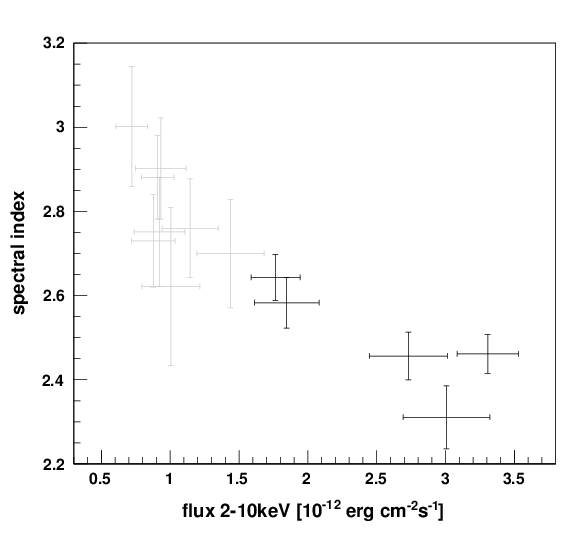
Figure 4: Flux-spectral index correlation of Swift-XRT; black points corresponding to the January observations and grey points to the April/May observations. The correlation coefficient was found to be r = −0.88, implying a strong (negative) correlation between integrated flux and spectral index.
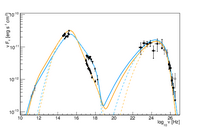
Figure 5: Spectral energy distribution of B2 1215+30 during 2011 together with the SSC model for a redshift of z = 0.130. The data points are the following (from low to high frequencies): (open diamonds) archival data, (•) optical data from MDM, (downwards-pointing triangles) high X-ray state observed by Swift -XRT & UVOT, (upwards-pointing triangles) low X-ray state observed by Swift -XRT & UVOT, (•) Fermi-LAT, (solid squares ) VERITAS, and (o) MAGIC. The blue lines represent the model for the high X-ray state data set and the orange lines the model for the low X-ray state, respectively. Solid lines take the archival data in the micrometer regime into account; dashed lines are the model using contemporaneous data only (see text for details).