One of the biggest mysteries in science in the early 21st century is that roughly 95% of the composition of the universe is still unknown. 27% is assumed to be dark matter (DM) with the rest being dark energy. A common hypothesis for dark matter composition is weakly interacting massive particles (WIMPs). WIMPs are hypothetical particles that are heavier than most standard model (SM) particles and only interact gravitationally with normal matter. They will self-annihilate, producing very-high energy (VHE) gamma rays or other SM particles that will emit VHE gamma rays. VERITAS searched for this gamma ray signature by looking at several dwarf spheroidal galaxies (dSphs). DSphs are small, low-luminosity galaxies in the local group in the Milky way, which are expected to have a large DM content. Additionally, DSphs will not emit VHE gamma rays through conventional astrophysical processes. VERITAS did a search using 230 hours of dSph data taken between 2007 and 2013. The method used in this paper combined several dSph targets into a single search. No signal was seen in this combined search. With the absence of a VHE signal, limits were placed on the thermally-averaged cross section of DM annihilation for WIMP masses between 100 GeV and 100 TeV.
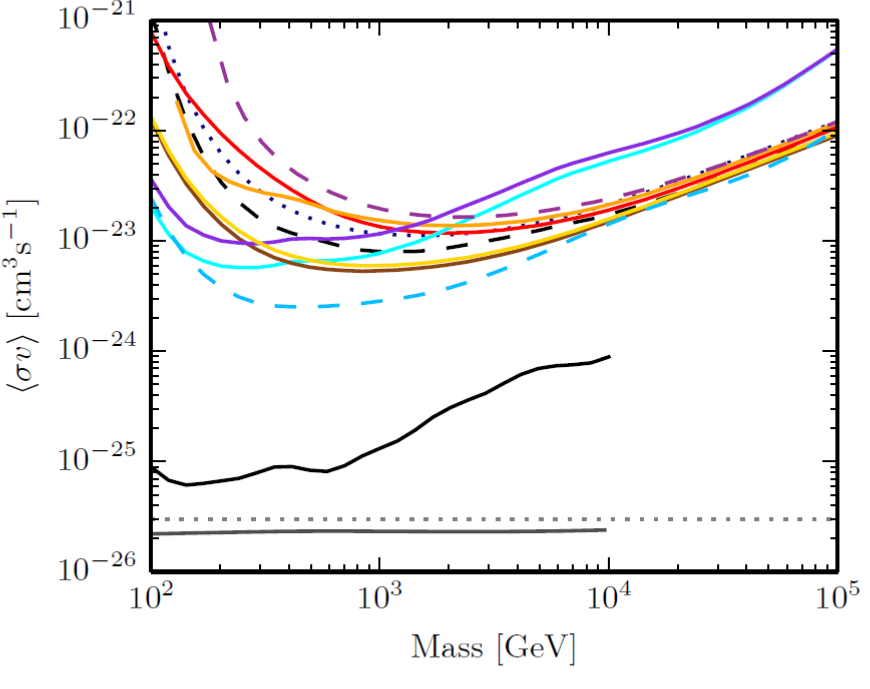
Figure 1: Illustration of the background method that is used for the photon weighting analysis in the dark matter search. The ON region is shaded in light blue, while the OFF region is shaded in red. Note that this gure is not drawn to scale. The standard off set from the center of the ON region to the tracking position is 0.5o .
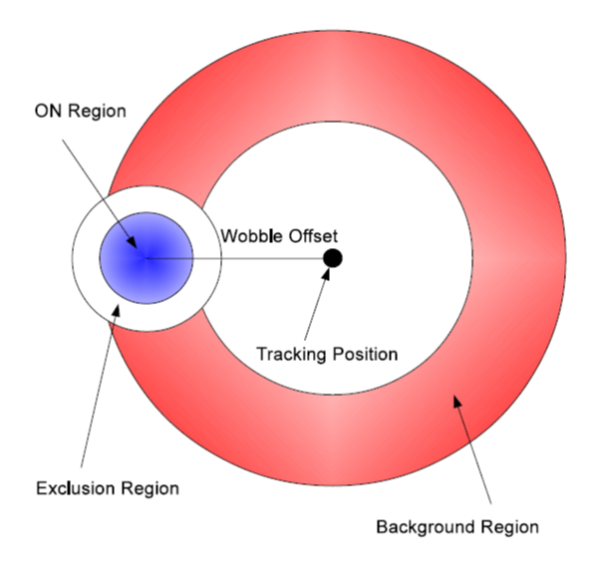
Figure 2: Mean point-spread function (left panel) and mean eff ective areas (right panel) vs. Monte Carlo (MC) energy for the observing conditions of the five dwarf spheroidals in this work.
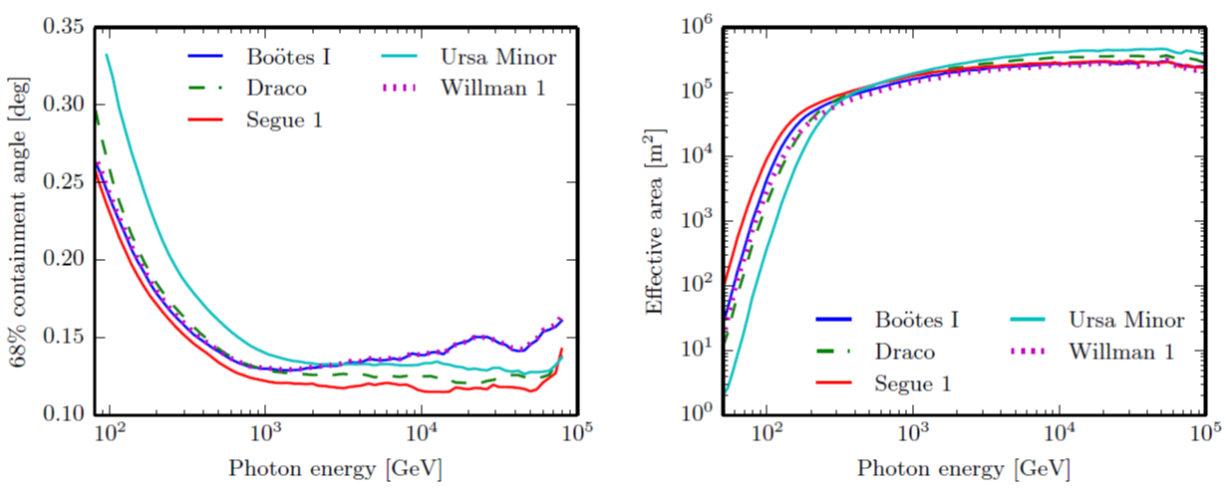
Figure 3: Results of the individual search for dark matter annihilation for three Standard Model fi nal states. For each dark matter mass (x-axis), the y-axis gives the signifi cance of detection, de fined as the quantile of the probability distribution of the background-only model. This probability is converted into a "σ value" using the inverse CDF of a standard Gaussian. The grey band represents a range of ± 1σ.

Figure 4: Results of the combined search for dark matter annihilation in the four dwarf galaxies whose dark matter density pro files can be reliably determined for annihilation into four standard model final states. For each dark matter mass (x-axis), the y-axis gives the signfii cance of detection, defined as the quantile of the probability distribution of the background-only model. This probability is converted into a "σ value" using the inverse CDF of a standard Gaussian. The dashed lines show how the detection significance depends on the uncertainty in the dark matter density profiles (the solid line is the median over all allowed density profiles).
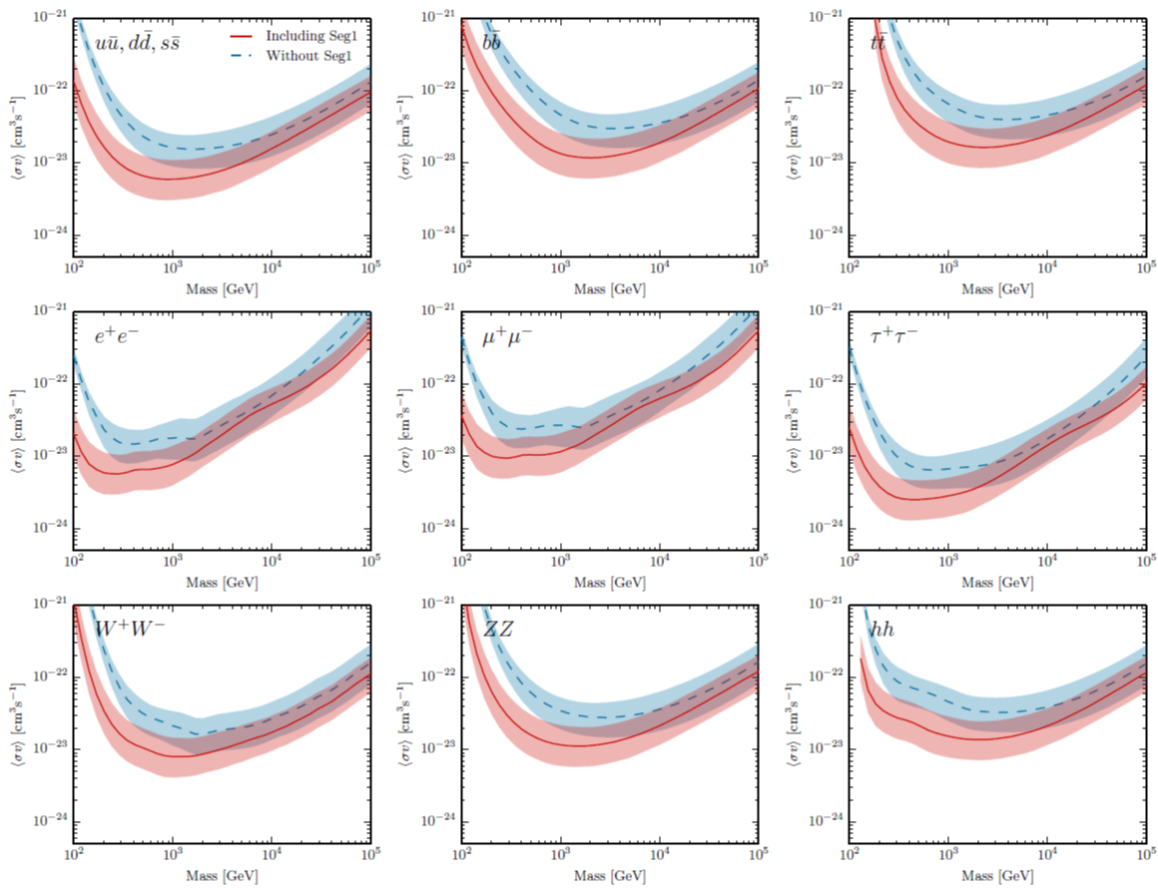
Figure 5: Annihilation cross section limits from the joint analysis of dwarf galaxies. The shaded bands are the systematic 1σ uncertainty in the limit derived from many realizations of halo J-profiles of the dwarfs consistent with kinematic data. The solid line depicts the median of this distribution of limits over the halo realizations with all dSphs except Willman 1. The dashed line depicts the median limits of the distribution of limits without Segue 1 and Willman 1. A machine-readable file tabulating these limits is available as supplemental material.

Figure 6: Expected annihilation cross section limits from the joint analysis of four dwarf galaxies. The green and yellow bands depict the a 68% and 95% chance of the limit being in these regions. The expected limit has a 50% chance to be below the dashed line, while the solid line shows the observed upper limit for a particular realization of halo density profile (the actual width spanned by the complete sample of different profiles is shown as the shaded area in each panel of Figure 5).
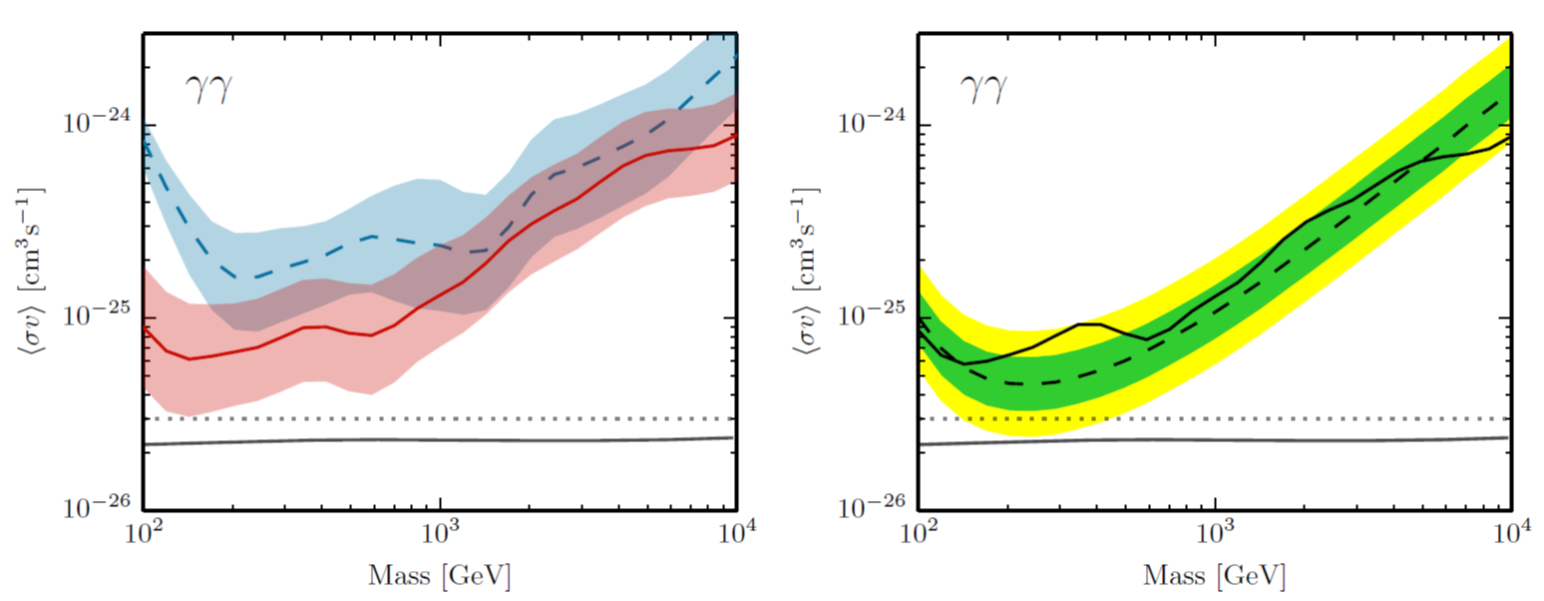
Figure 7: Same as Figures 5 & 6 for the case of dark matter annihilation to a two photon final state.
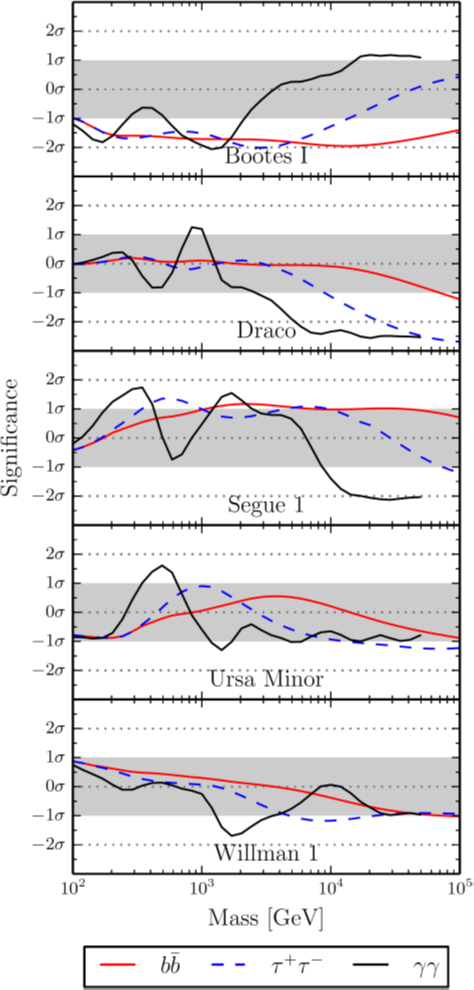
Figure 8: The median annihilation cross section limit from all dwarf galaxies and for all channels (the solid curves of Figure 5 and 7). The strongest continuum constraints are from a heavy lepton final state. The thin dashed horizontal line corresponds to the benchmark value of the required relic abundance cross section (3 × 10⁻²⁶cm3 /s), while the solid horizontal line corresponds to the detailed calculation of this quantity [39].
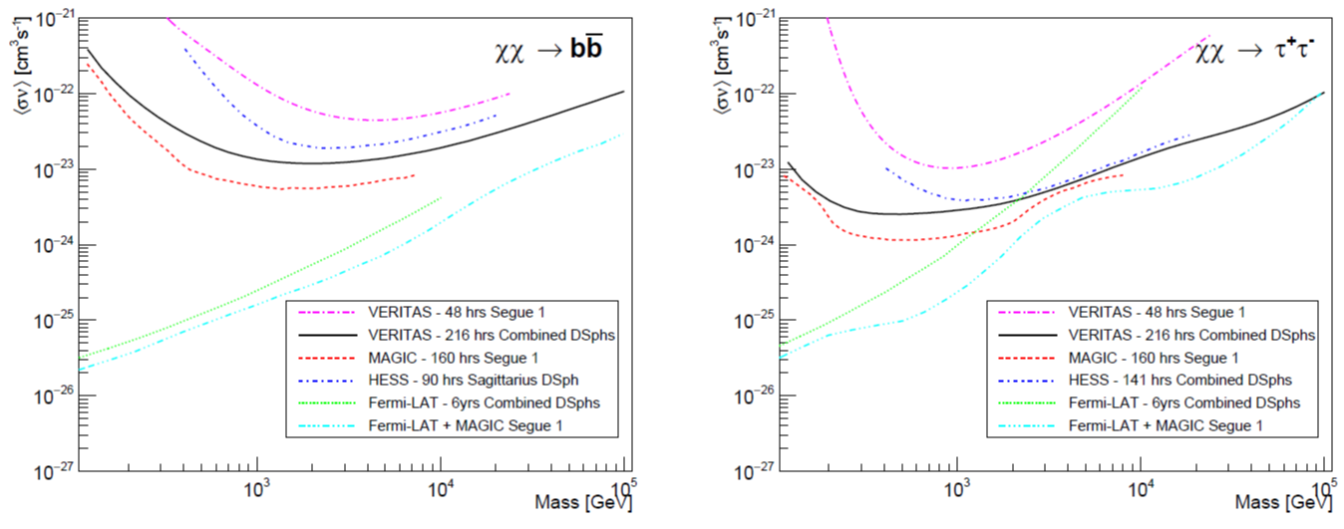
Figure 9: Annihilation cross section limits for dwarf spheroidal galaxies from this work, HESS [1], MAGIC [4], Fermi-LAT [3], a combined result of MAGIC and Fermi-LAT [28] as well as previous VERITAS results [6] for the b-bar-b (left) and τ+τ− (right) channels.