The IACT technique used by VERITAS has proven to be extremely powerful for observing gamma rays. At its heart is the use of photo-multiplier tubes (PMTs) to detect the faint flash of Cherenkov light induced by particle air showers. The disadvantage of using PMTs is that they are easily damaged by bright light; this has limited observations to "dark" periods with little or no moonlight. VERITAS has developed two techniques to allow observations to be conducted under higher levels of background light. The first, reduced high voltage (RHV), lowers the voltage applied to the PMTs. This reduces their gain and thus the current flowing through them for a given light level, which reduces the rate at which they age. However, RHV observations do not counteract the increasing background light level, which reduces the signal-to-background and lowers the sensitivity, especially to low energy showers. A second method was developed where an ultra-violet (UV) bandpass filter is used to preferentially remove the visible light striking the PMTs. This ultra-violet filter (UVF) technique protects the PMTs whilst also improving the signal-to-background, though at the cost of reduced signal size. Both techniques have been used by VERITAS and they are presented along with their validation. The RHV technique is found to have similar sensitivity to normal observations for all but the lowest energy observations; the UVF technique has a significantly increased energy threshold and a slight reduction in sensitivity. Using these techniques observations are now possible in all but the brightest conditions.
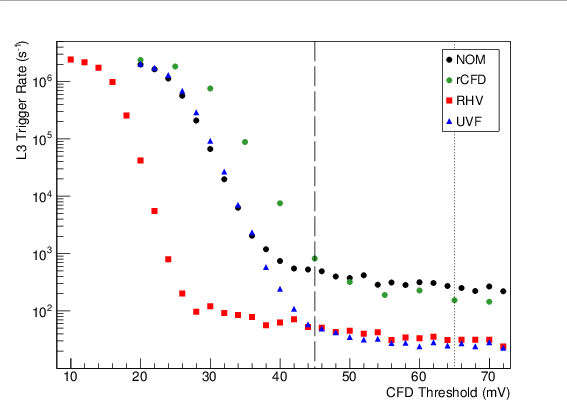
Figure 1: Array trigger rate versus CFD threshold for four different observing modes under typical conditions for that mode. “rCFD” corresponds to data taken under low levels of moonlight when observations are conducted with raised CFD thresholds at 65 mV (dotted line) rather than the normal 45 mV (dashed line). It can clearly be seen that for low thresholds, the trigger rate is substantially higher even under low amounts of moonlight, in this case raising the threshold from 45 to 65 mV results in a reduction in the L3 rate by a factor of ~5 for the rCFD data. Data for the RHV and UVF observing modes (described later in the main text) are also shown.
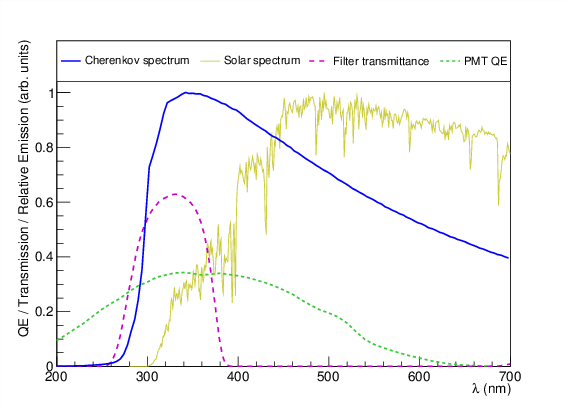
Figure 2: VERITAS PMT (Hamamatsu R10560-100-20MOD) quantum efficiency and SCHOTT UG-11 total filter transmittance (for a 3 mm thick filter including reflection and correction for nonnormal incidence). Also plotted are the Cherenkov spectrum of a 500 GeV gamma-ray shower and the solar spectrum. Both spectra have been corrected for the effects of atmospheric absorption but not for the effects of mirror reflectivity.
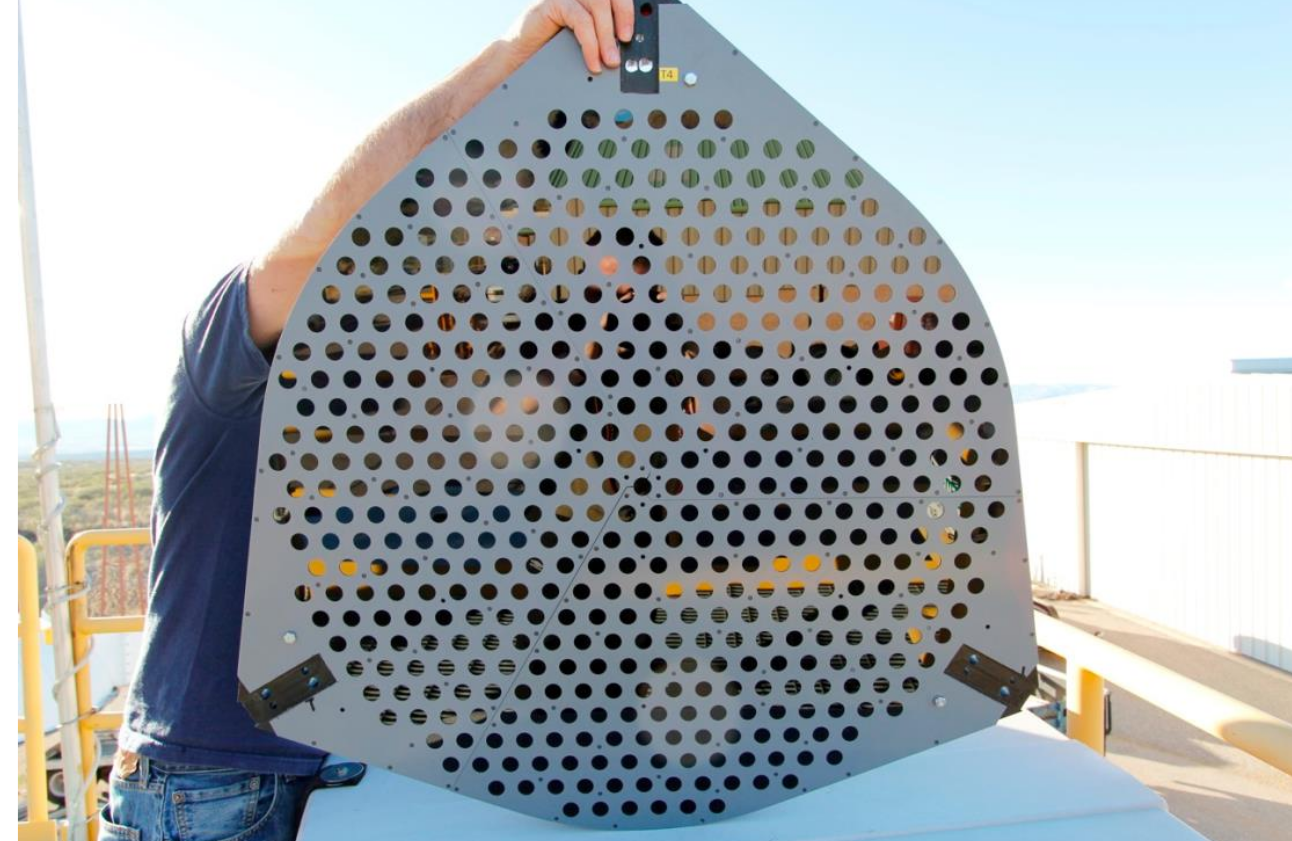
Figure 3: A UV filter plate with one filter for each PMT mounted in a central plastic layer which is then sandwiched between two thin (gray) plastic sheets with holes smaller than the filters but larger than the exit apertures of the light cones.
Figure 4: Breakdown of a typical observing month for VERITAS. This strategy is a guideline more than a rule; observing modes are chosen based on the PMT currents at the time of observing, rather than at fixed intervals.
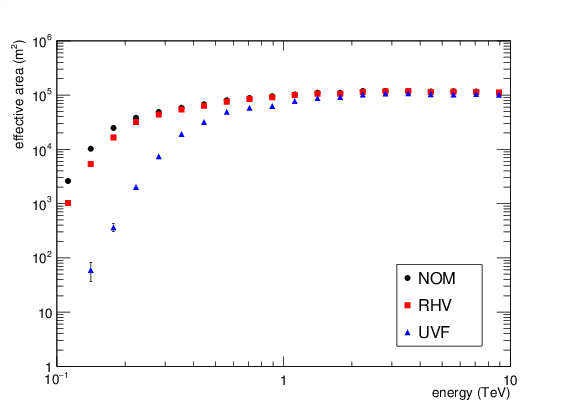
Figure 5: Typical gamma-ray effective areas for the three observing modes at 20 o zenith angle and typical observing conditions for that mode. Above 300 GeV, RHV is very similar to NOM. Conversely, UVF is less than the NOM configuration at all energies; this is consistent with there being a reduced collection efficiency due to the reduction in the number of Cherenkov photons reaching the PMTs due to the filters, reducing the sensitivity to faint showers.
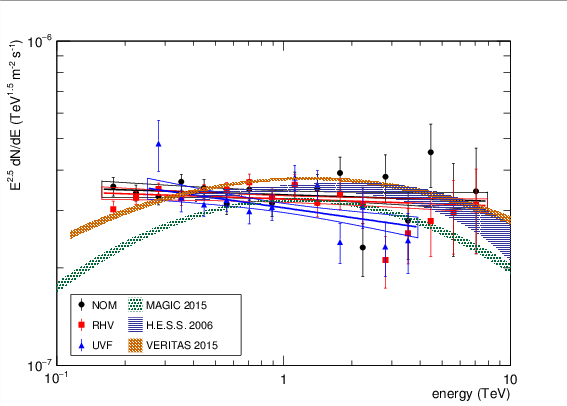
Figure 6: Crab Nebula energy spectra for the three observing modes. Each data set has been fitted with a power law. The color bands represent the 1σ contours on each fit (statistical errors only). The values for all the fits are given in Table 2. Also included are historical measurements made by H.E.S.S. [4], MAGIC [40] and VERITAS [39] shown as their 1σ statistical error bands.