Blazars are variable emitters across all wavelengths over a wide range of timescales, from months down to minutes. It is therefore essential to observe blazars simultaneously at different wavelengths, especially in the X-ray and gamma-ray bands, where the broadband spectral energy distributions usually peak. However, such data are often lacking, complicating studies of rapid variability on sub-hour timescales.
The MAGIC telescopes observed on 2014 April 25 a VHE gamma-ray flux of about eight times the flux of the Crab Nebula from the bright TeV blazar Mrk 421, which is about 16 times brighter than usual. This triggered a joint "target-of-opportunity'' (ToO) program by XMM-Newton, VERITAS, and MAGIC.
Three observations were obtained, featuring long, continuous, and simultaneous exposures with XMM-Newton (covering X-ray and optical/ultraviolet bands) and VERITAS (covering the TeV gamma-ray band), along with contemporaneous observations from other gamma-ray facilities (MAGIC and Fermi-LAT) and a number of radio and optical facilities. Although neither rapid flares nor significant X-ray/TeV correlation are detected, these observations reveal subtle changes in the X-ray spectrum of the source over the course of a few days. We search the simultaneous X-ray and TeV data for spectral hysteresis patterns and time delays, which could provide insight into the emission mechanisms and the source properties (e.g. the radius of the emitting region, the strength of the magnetic field, and related timescales). The observed broadband spectra are consistent with a one-zone synchrotron self-Compton model. We find that the power spectral density distribution above 4x10^-4 Hz from the X-ray data can be described by a power-law model with an index value between 1.2 and 1.8, and do not find evidence for a steepening of the power spectral index (often associated with a characteristic length scale) compared to the previously reported values at lower frequencies.
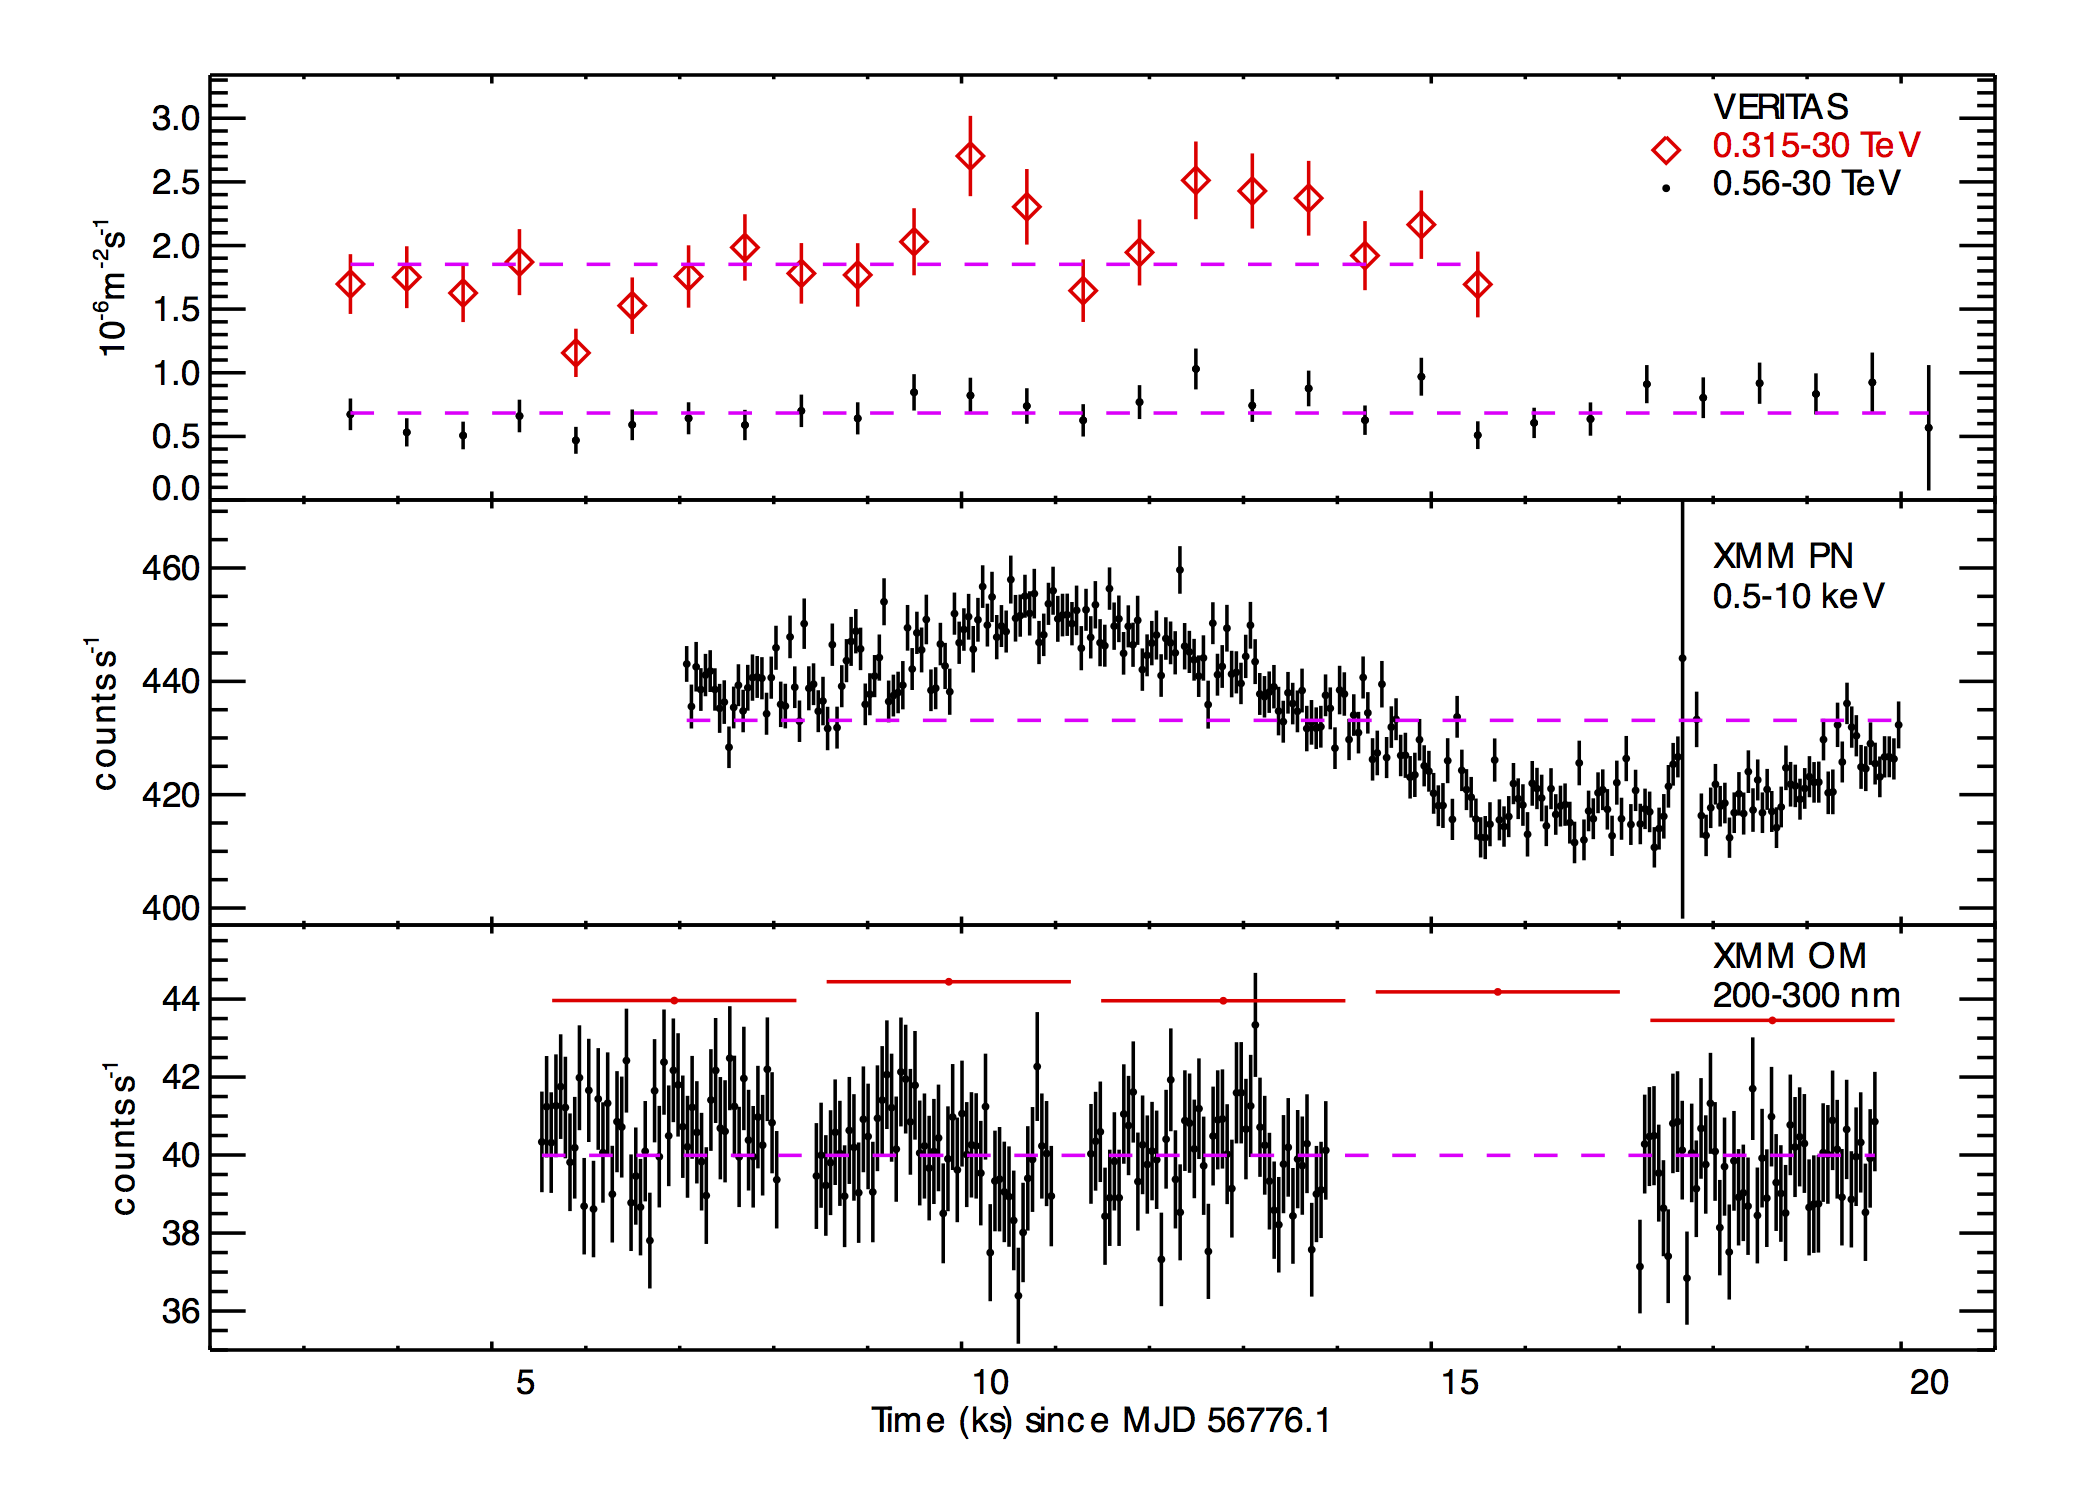
Figure 1: XMM-Newton and VERITAS light curves of Mrk 421 from 2014 Apr 29 simultaneous ToO observations. Top panel: VERITAS flux light curves, integrated above the highest energy threshold of all runs on that night in 10-minute bins. Middle panel: XMM-EPN count rates between 0.5 and 10 keV in 50-s bins. Bottom panel: The black points are XMM-OM fast mode optical count rates between 200 and 300 nm in 50-s intervals, and the red points are OM image mode count rates binned by exposure.
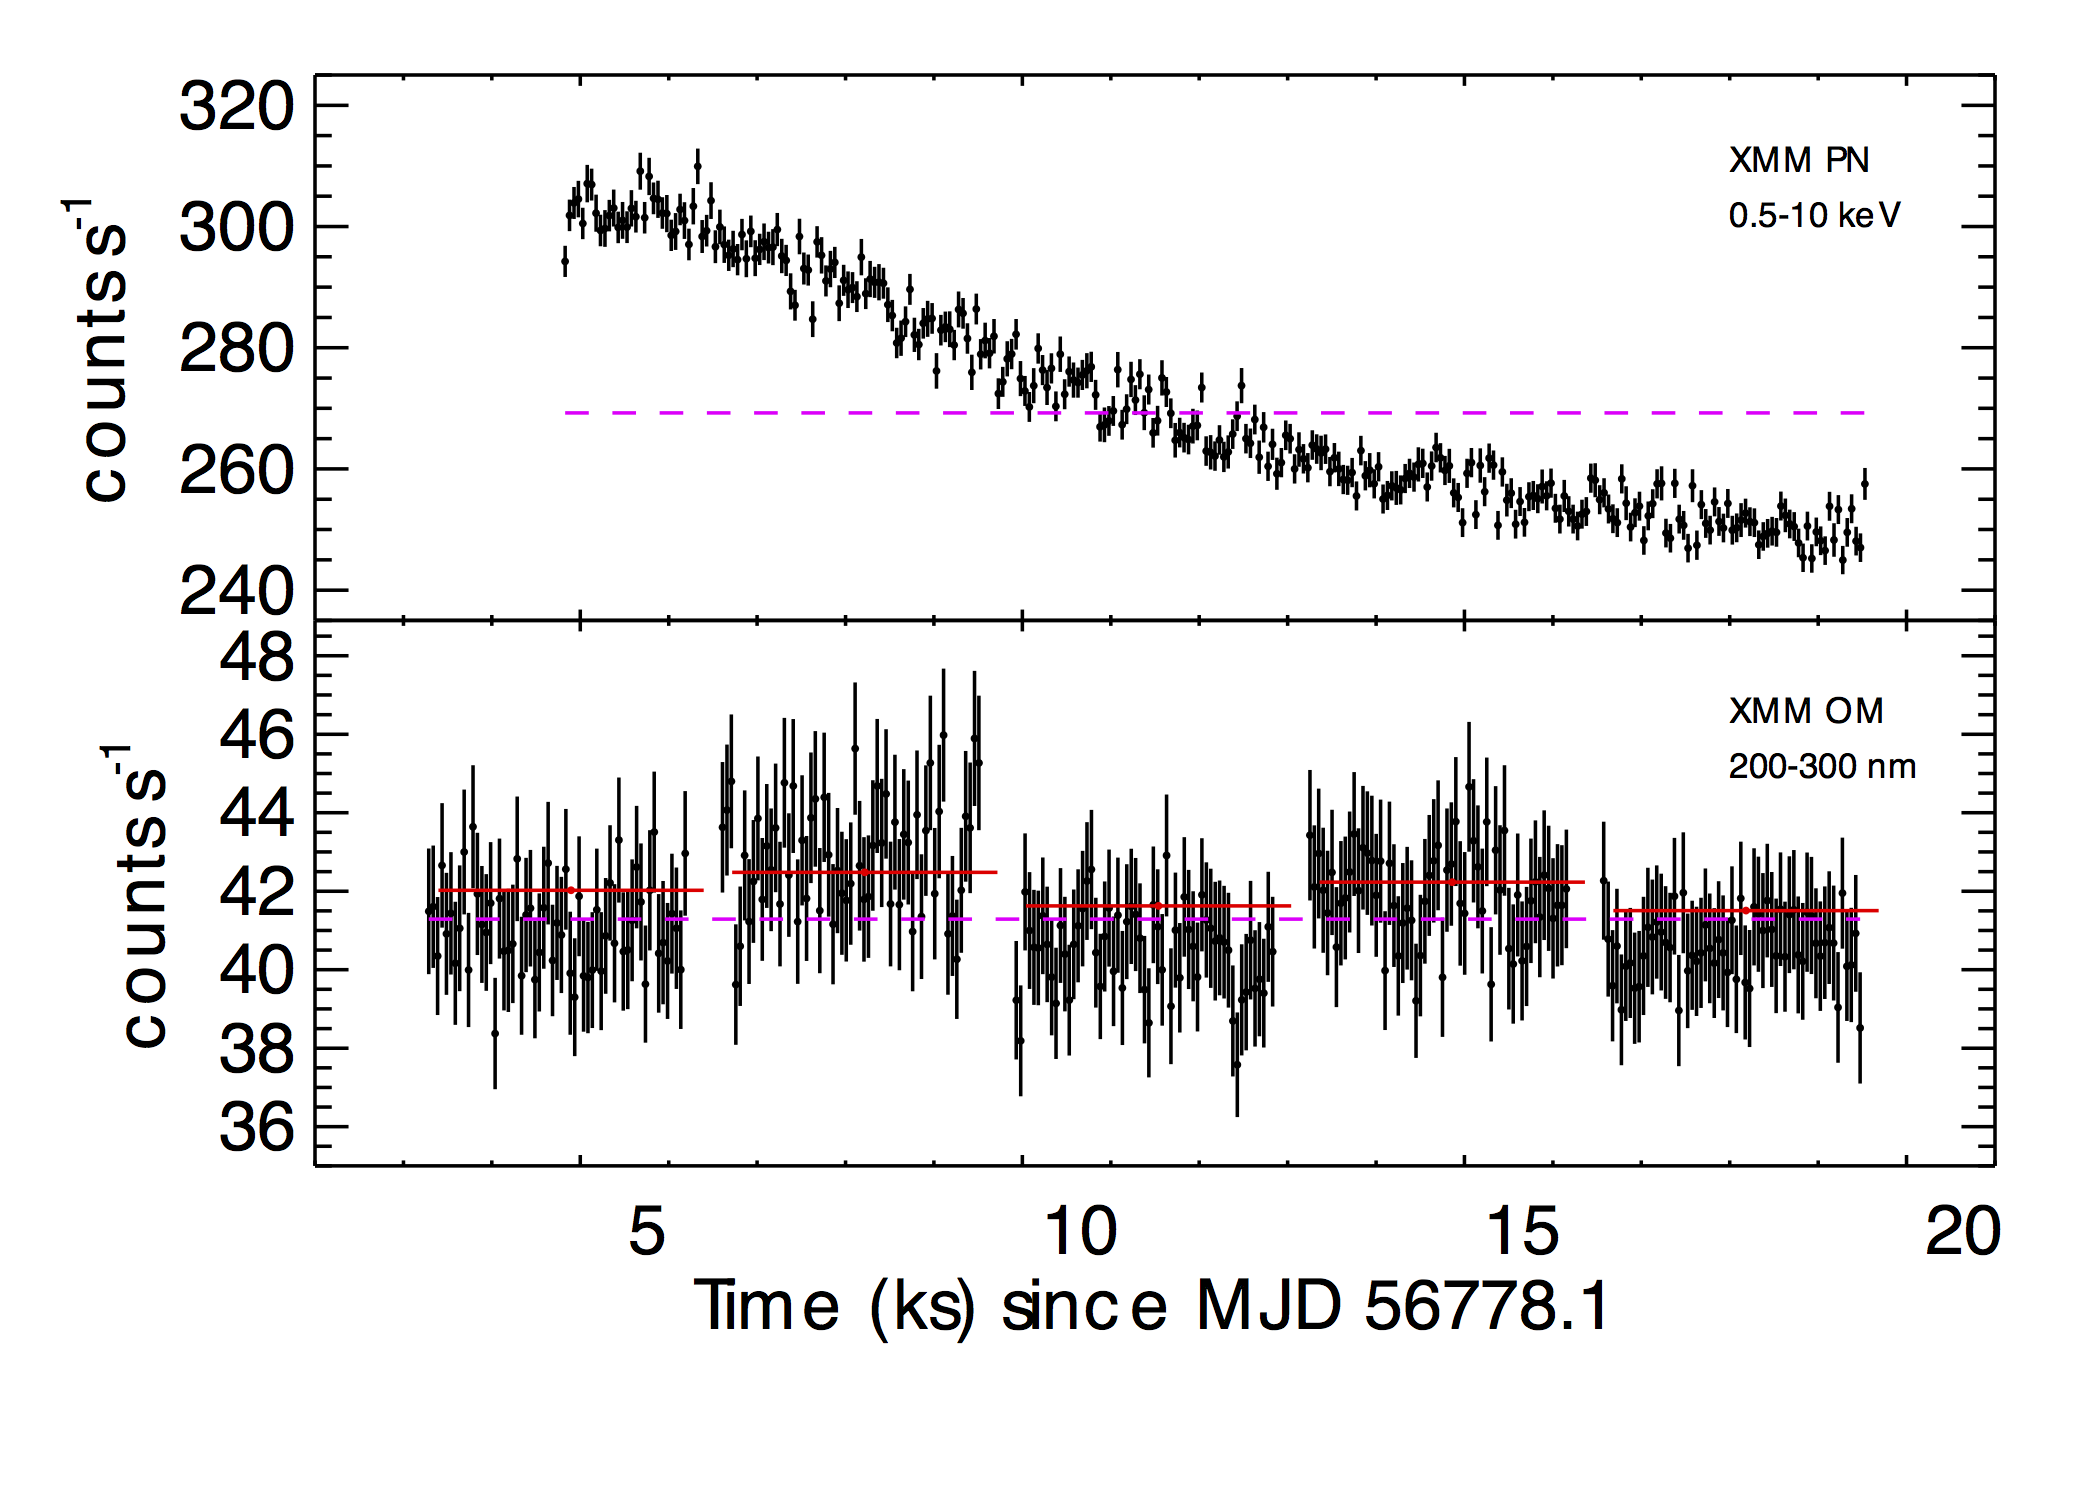
Figure 2: XMM-Newton light curves of Mrk 421 from 2014 May 1 ToO observations. Top panel: XMM-EPN count rates between 0.5 and 10 keV in 50-s bins. Bottom panel: The black points are XMM-OM fast mode optical count rates between 200 and 300 nm in 50-s bins, and the red points are OM image mode count rates binned by exposure. Note that VERITAS data on May 1 are not shown because the data were taken under poor weather conditions.
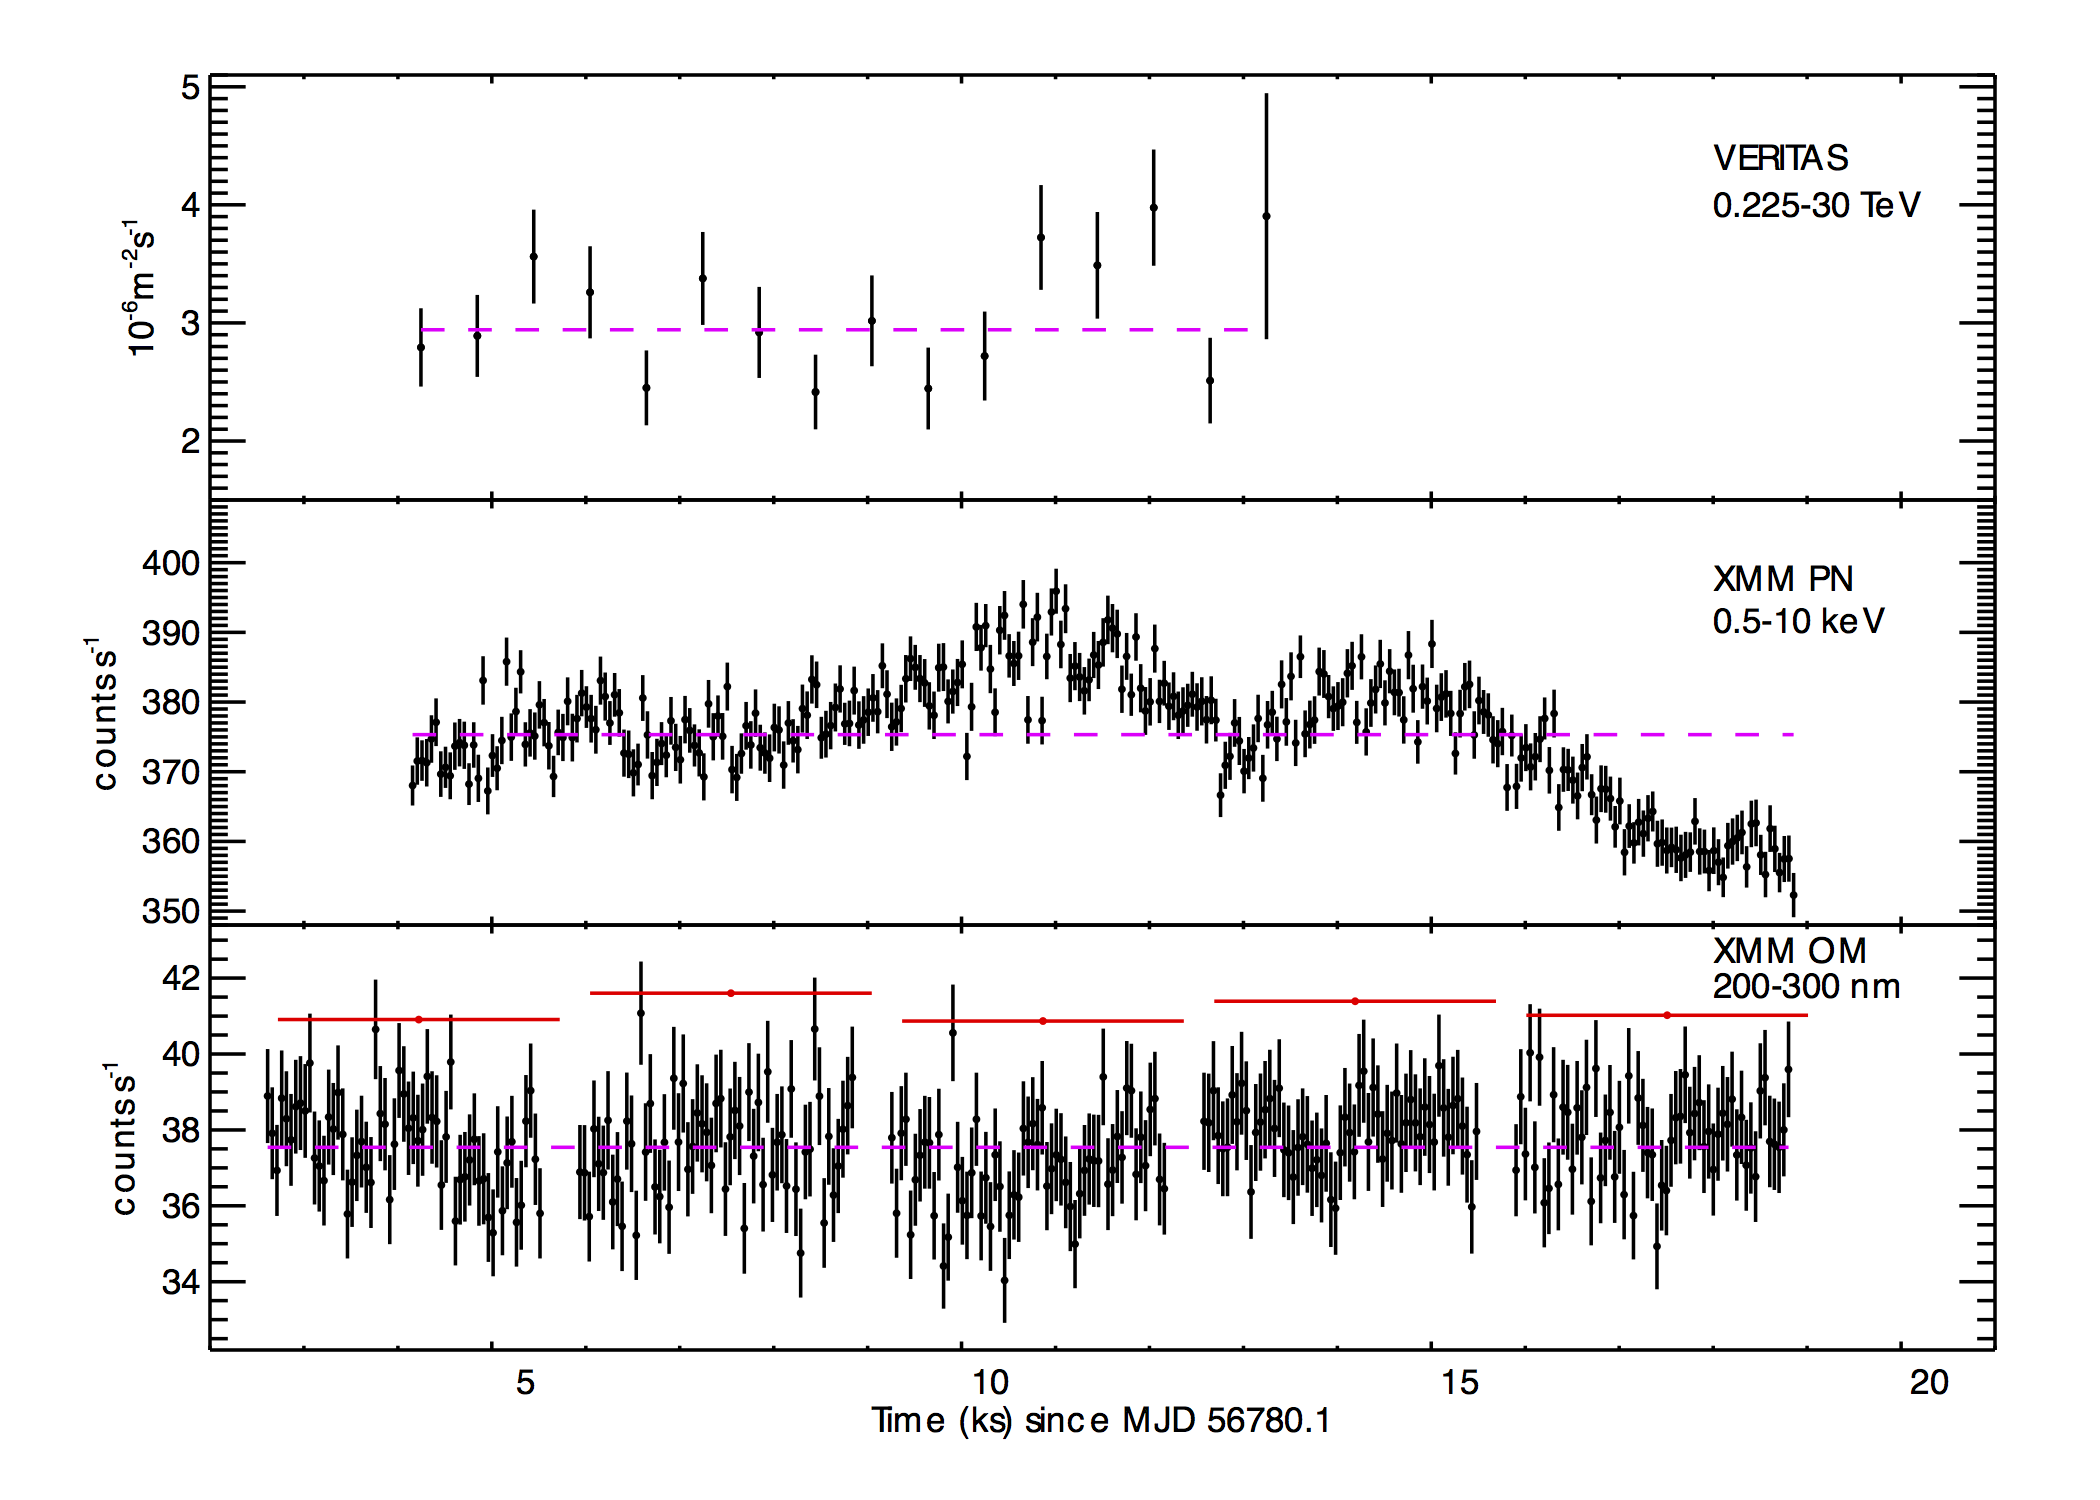
Figure 3: XMM-Newton and VERITAS light curves of Mrk 421 from 2014 May 3 simultaneous ToO observations. Top panel: VERITAS flux light curves, integrated above the highest energy threshold of all runs on that night in 10-minute bins. Middle panel: XMM-EPN count rates between 0.5 and 10 keV in 50-s bins. Bottom panel: The black points are XMM-OM fast mode optical count rates between 200 and 300 nm in 50-s bins, and the red points are OM image mode count rates binned by exposure.

Figure 4: Fractional variability of VHE and X-ray light curves of Mrk 421 from the three simultaneous ToO observations in 2014. Open squares are calculated from VERITAS light curves with 600-s time bins and 15-ks duration on the two nights under good weather conditions, and open diamonds are from XMM-EPN light curves with 50-s time bins and 15-ks duration. The results from three energy intervals (0.5-1 keV, 1-3 keV, and 3-10 keV) in the X-ray band are shown. Navy points represent the measurements on April 29, blue points for May 1, cyan ones for May 3, and gray ones for the duration of one week. The gray open square is from the VERITAS one-week flux measurements, and the gray cross is from the MAGIC one-week flux measurements. Both VHE fluxes are above 560 GeV with a 30-minute bin width. The gray diamonds are calculated from the XRT light curve with
a 50-s bin width and a one-week duration, and the gray filled circles are from the Steward Observatory light curve sampled at intervals of a few hours with one-week duration.
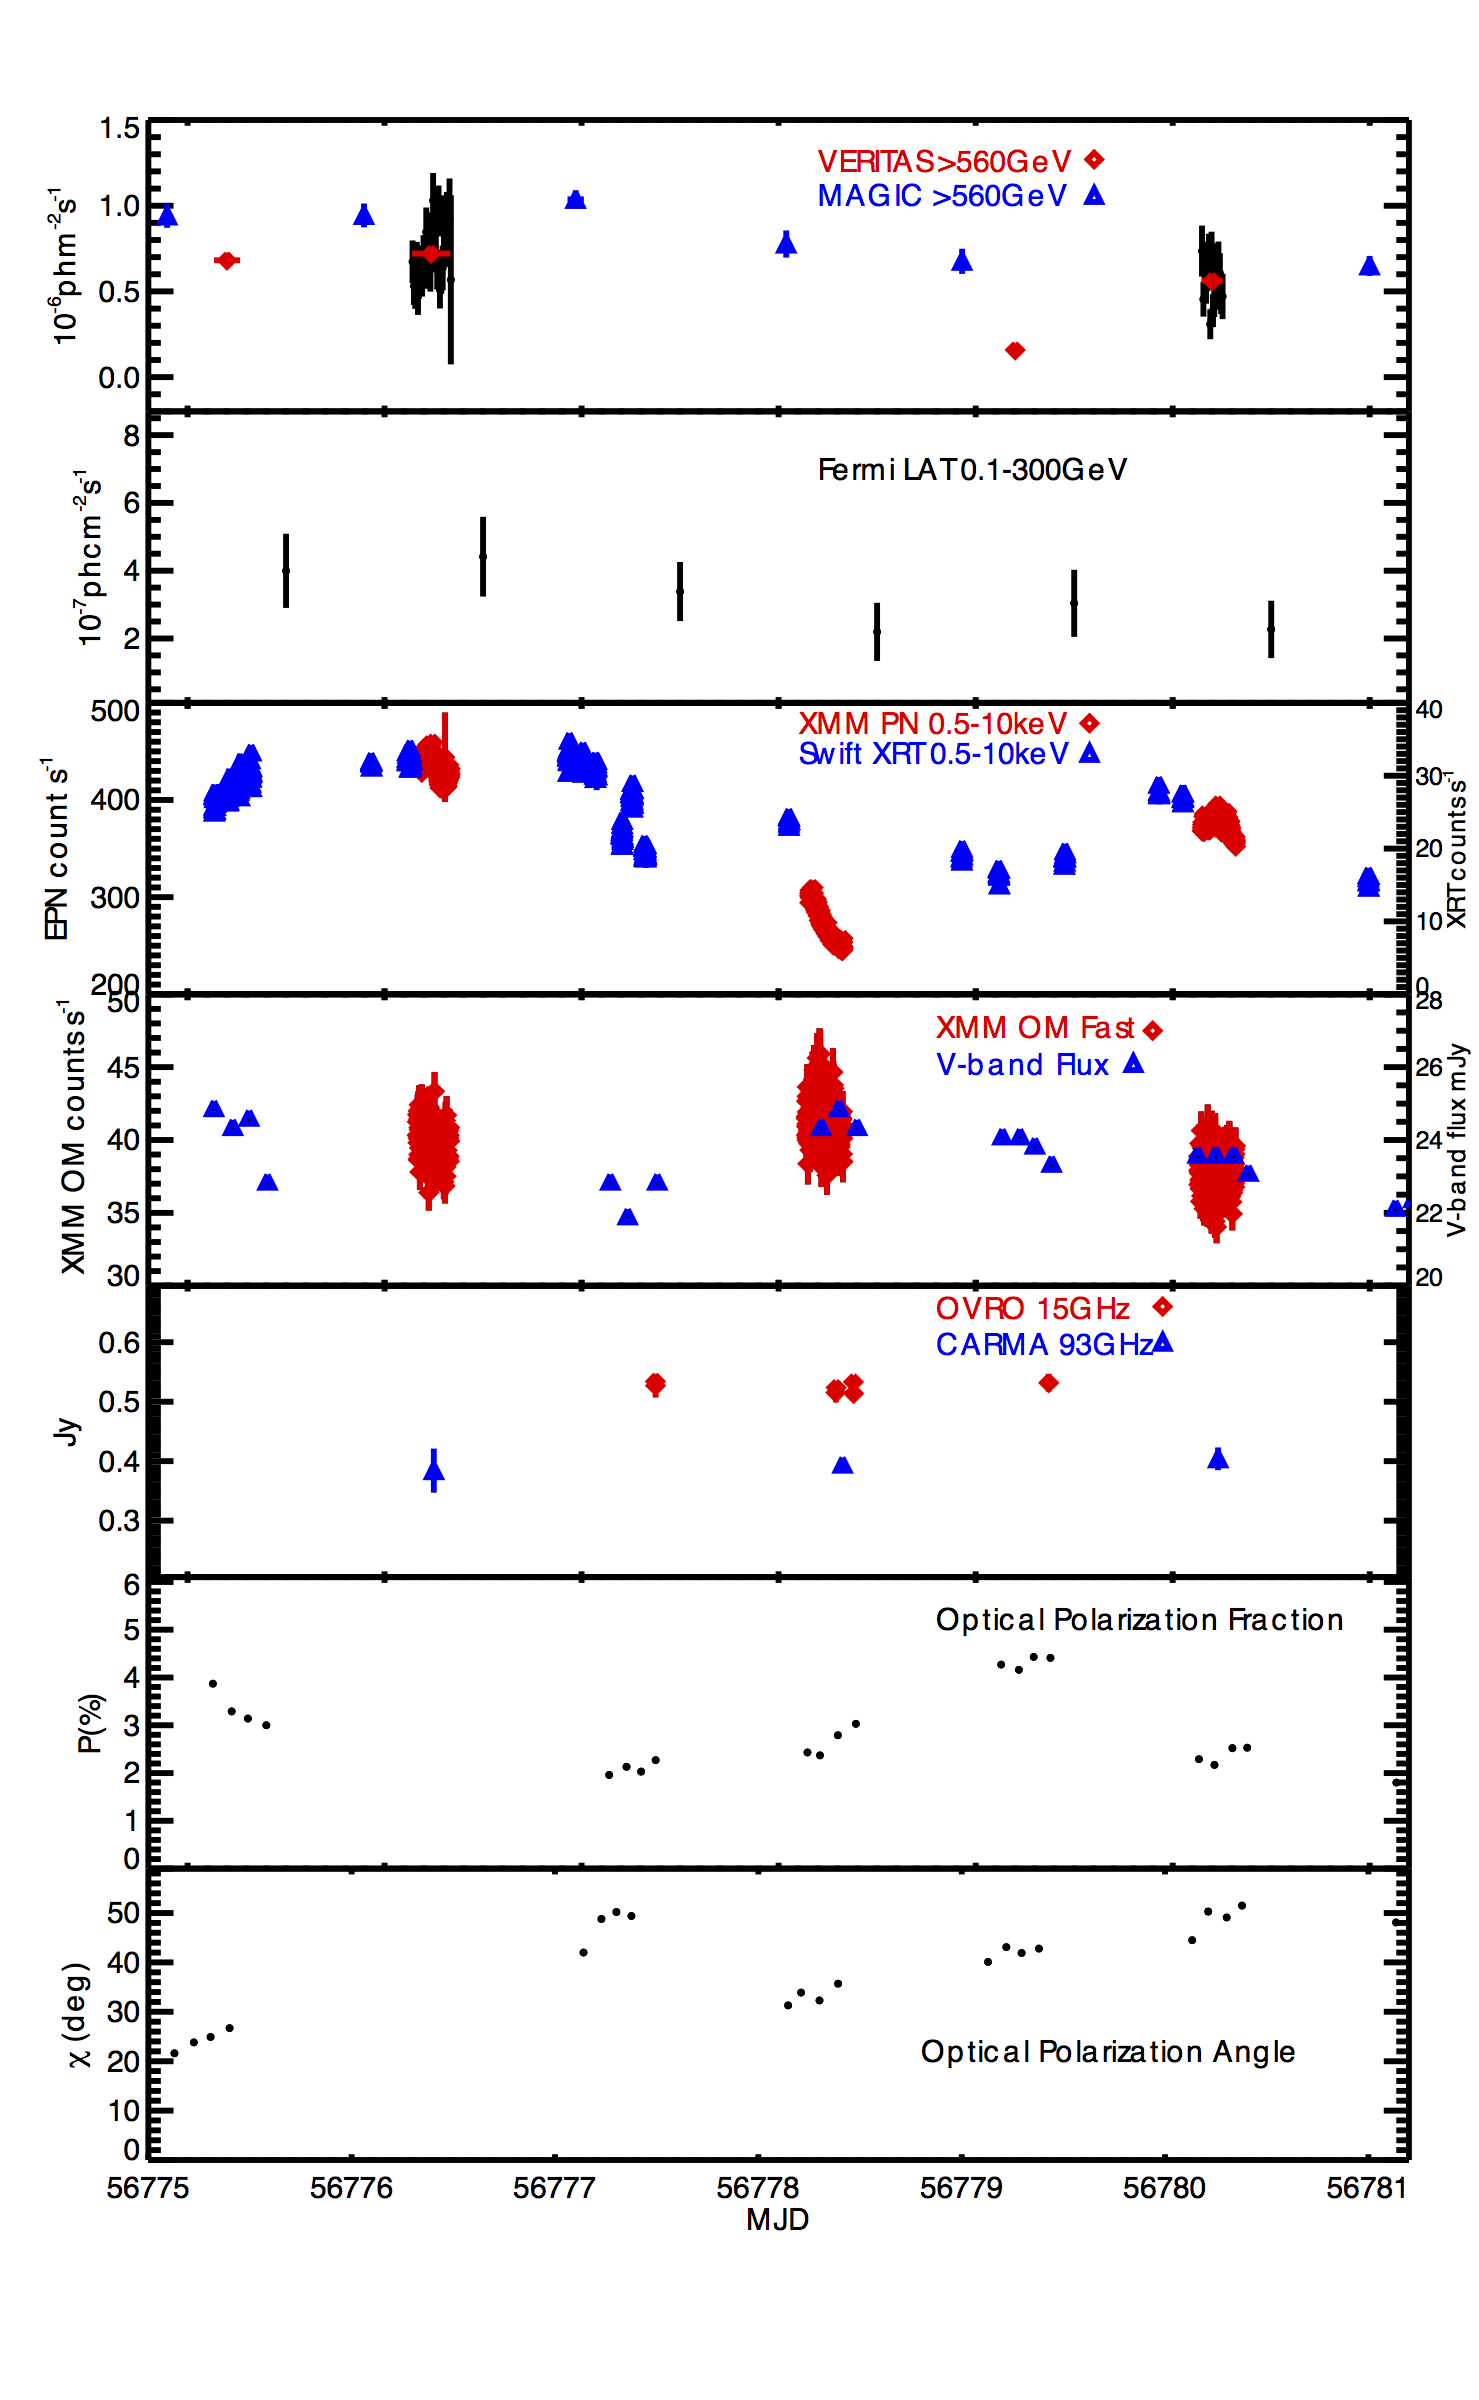
Figure 5: MWL light curves between Apr 28 and May 4. See text for details of the light curve in each panel.
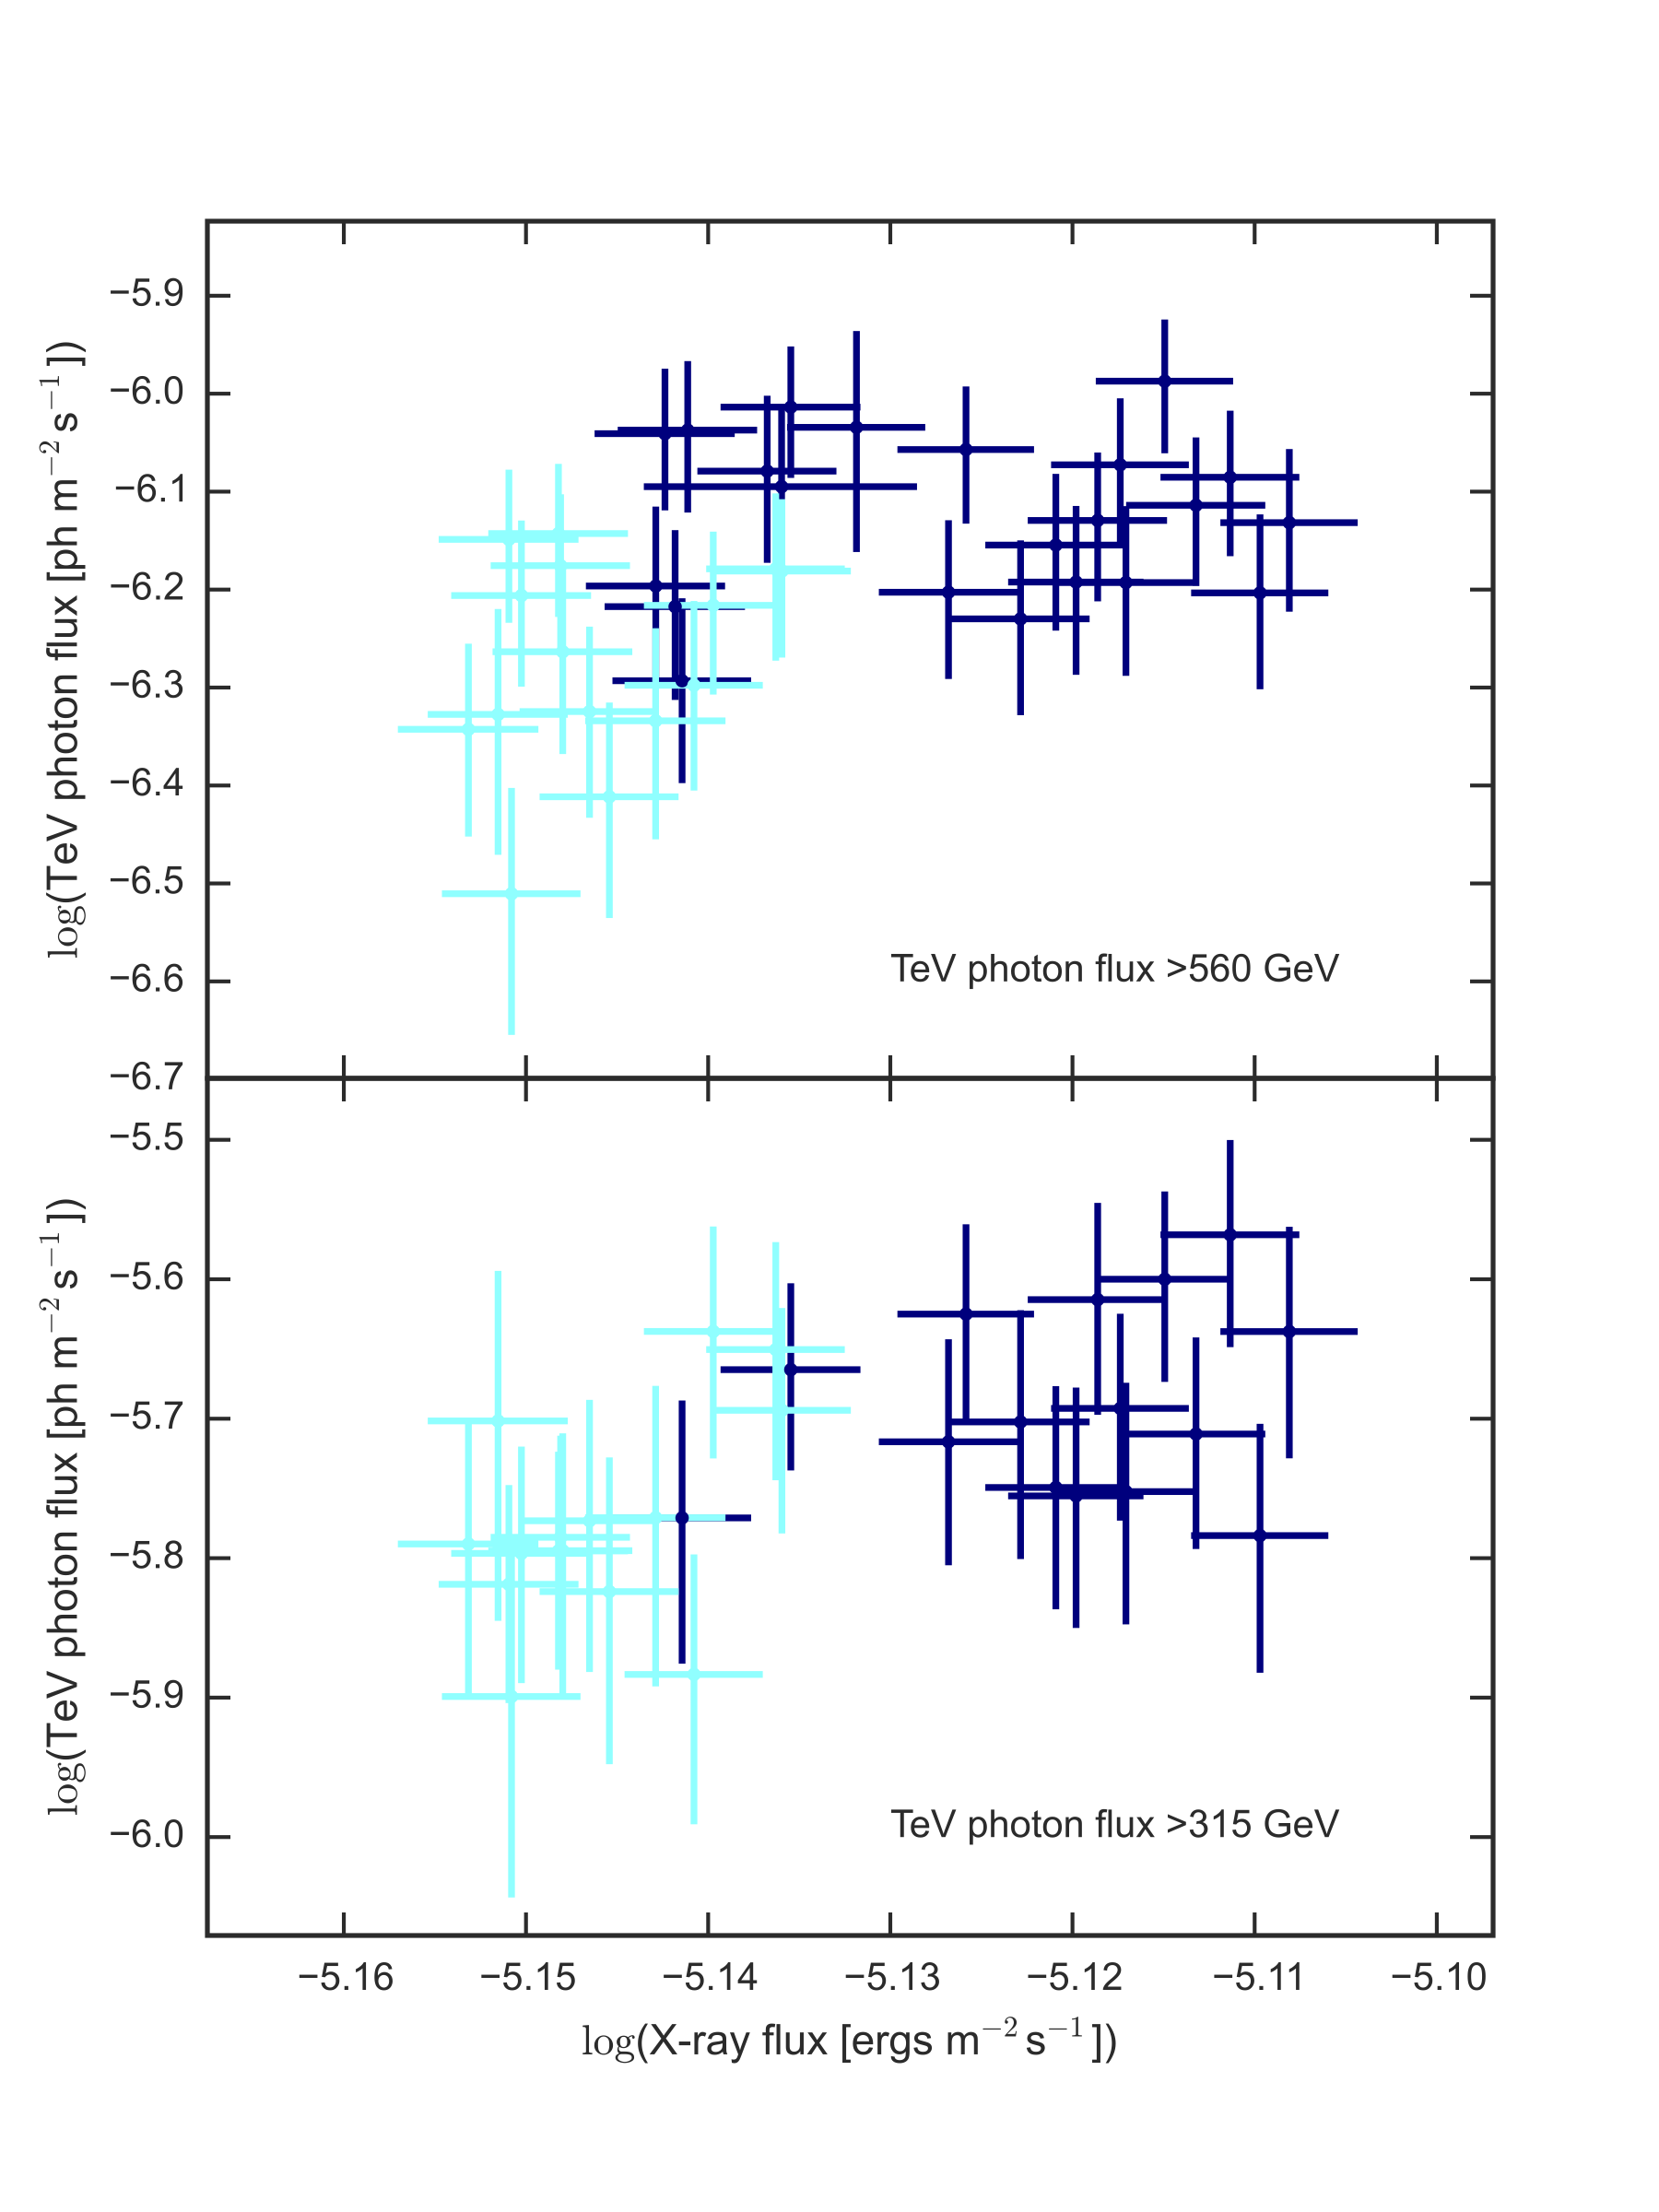
Figure 6: TeV photon flux versus X-ray energy flux from the simultaneous observations on 2014 April 29 (shown in navy) and May 3 (shown in cyan). The VHE fluxes are measured by VERITAS integrated above 560 GeV (top panel) and 315 GeV (bottom panel); X-ray
energy flux values are converted from the XMM-EPN count rates using ECFs based on the best-fi t photon index and neutral hydrogen density of each night. Both X-ray and TeV data are binned in 10-minute intervals.
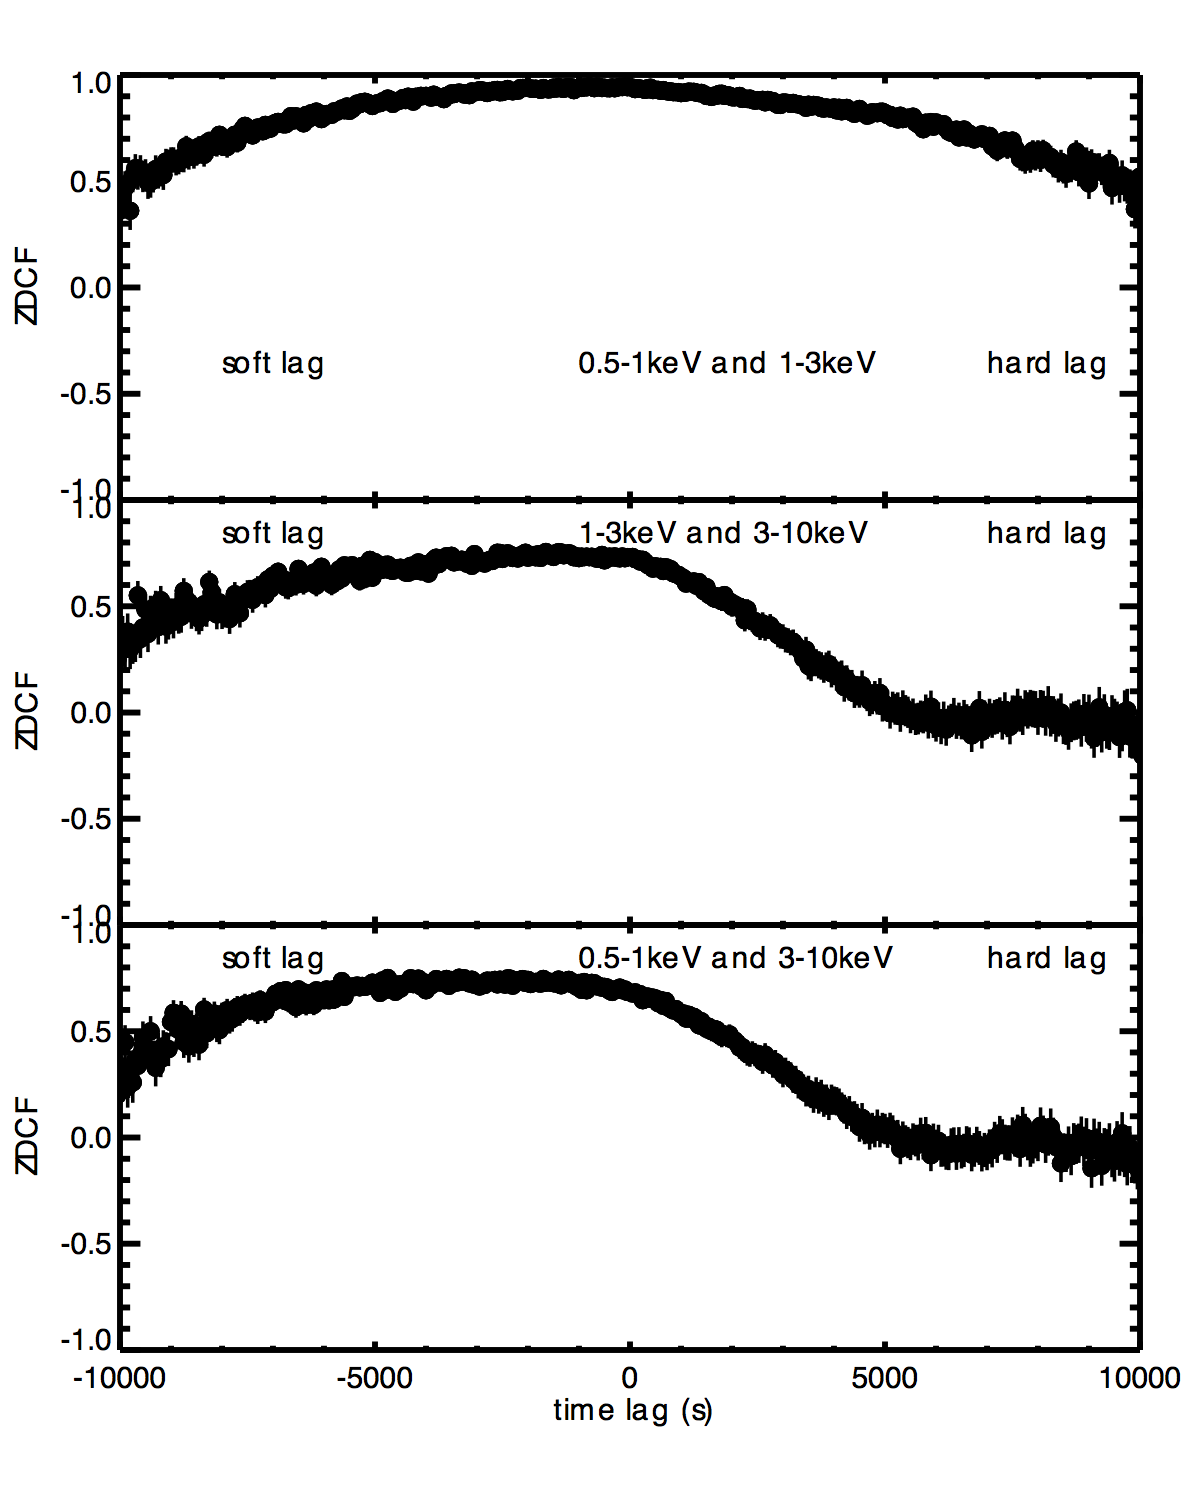
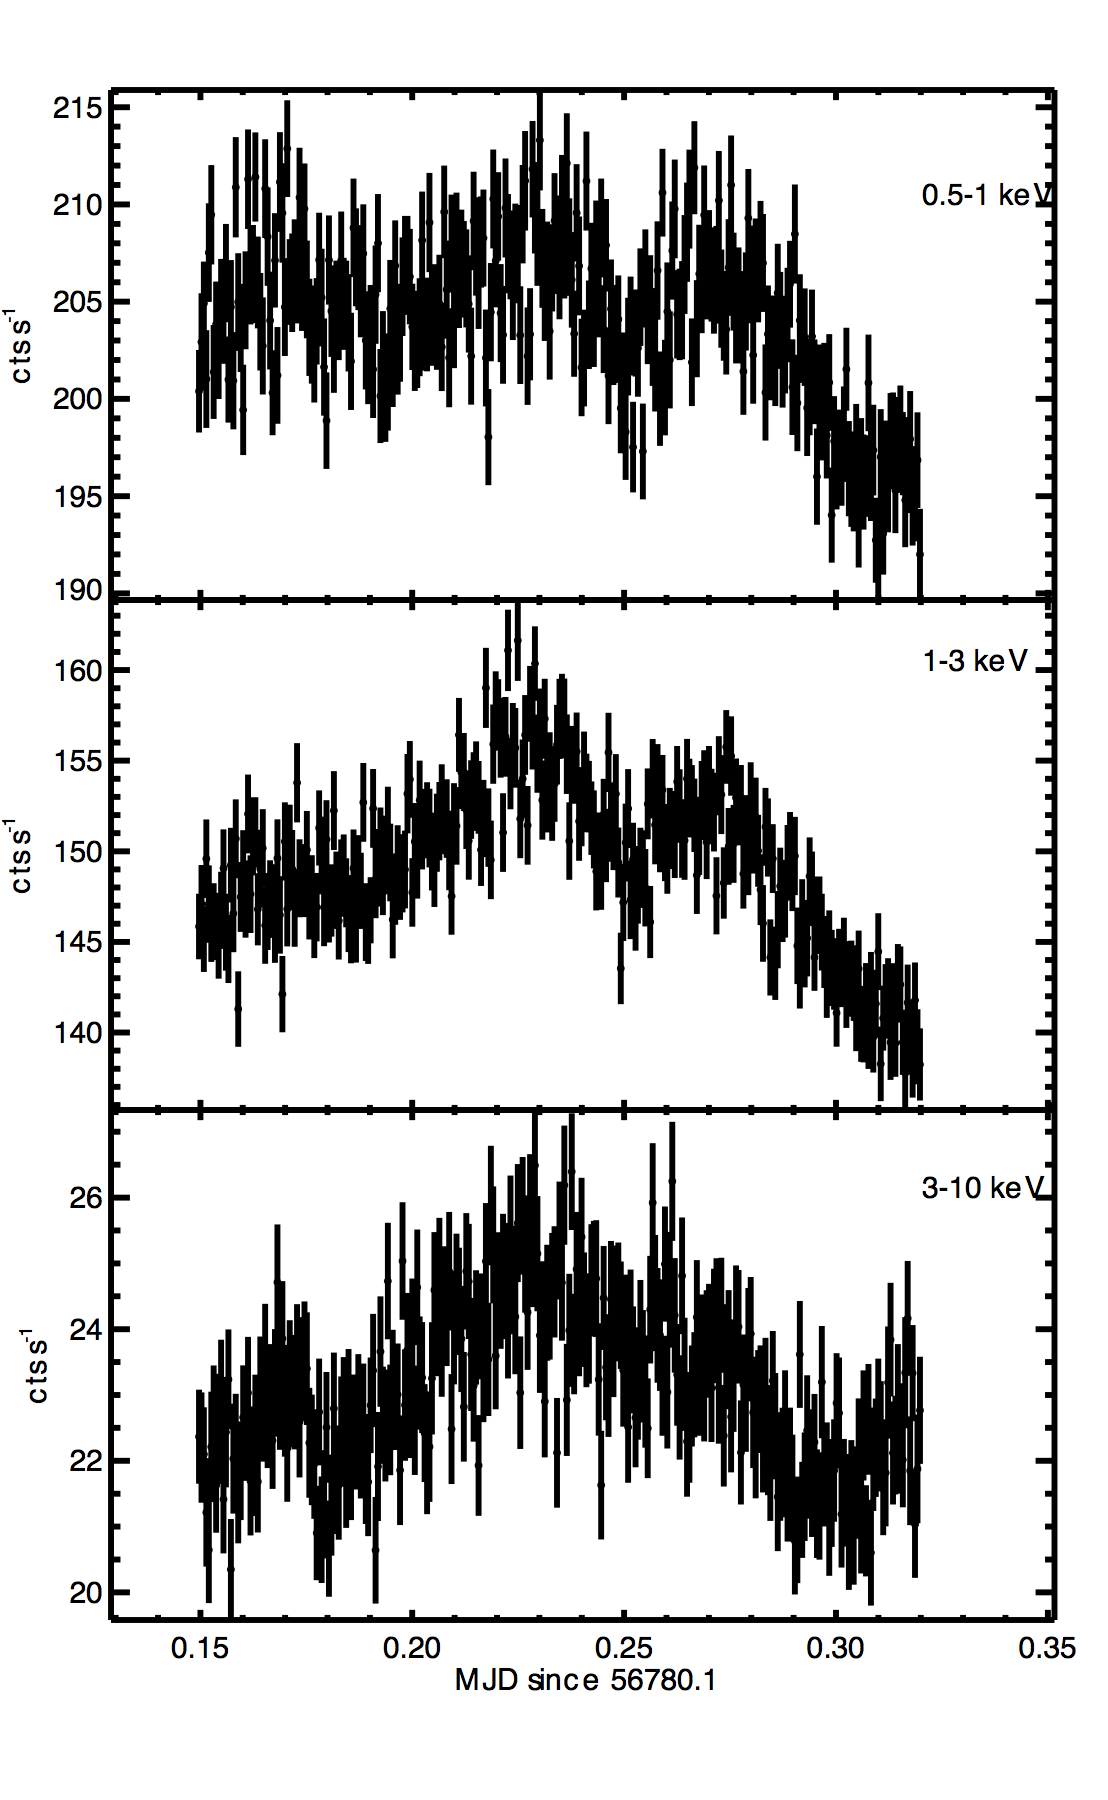
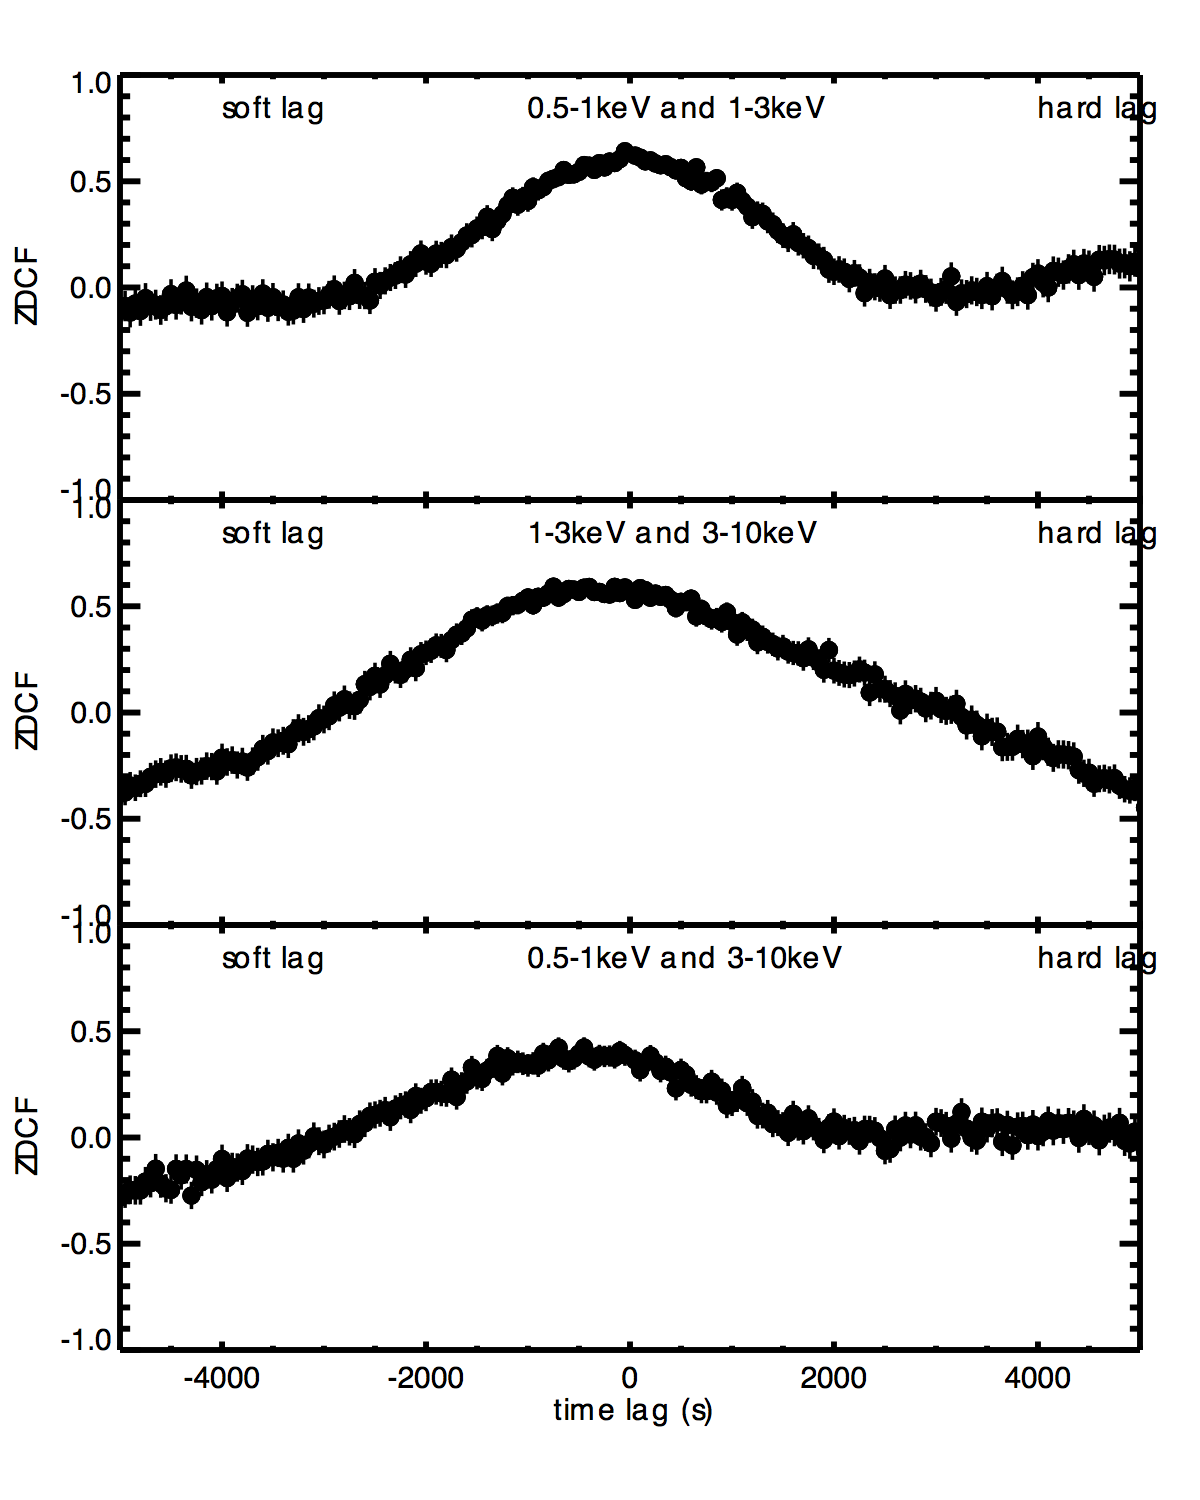
Figure 7: Left panel: Light curves of Mrk 421 observed with XMM-Newton-EPN on 2014 Apr 29. Count rates binned in 50 s time intervals in three energy bands, 0.5-1 keV, 1-3 keV, and 3-10 keV, are shown from top to bottom panel, respectively. Right panel: the ZDCF between these three X-ray bands. Positive lag values indicate "hard lag".
Figure 8: Left panel: Light curves of Mrk 421 observed with XMM-Newton-EPN on 2014 May 1. Count rates binned in 50 s time intervals in three energy bands, 0.5-1 keV, 1-3 keV, and 3-10 keV, are shown from top to bottom panel, respectively. Right panel: the ZDCF between these three X-ray bands. Positive lag values indicate "hard lag".
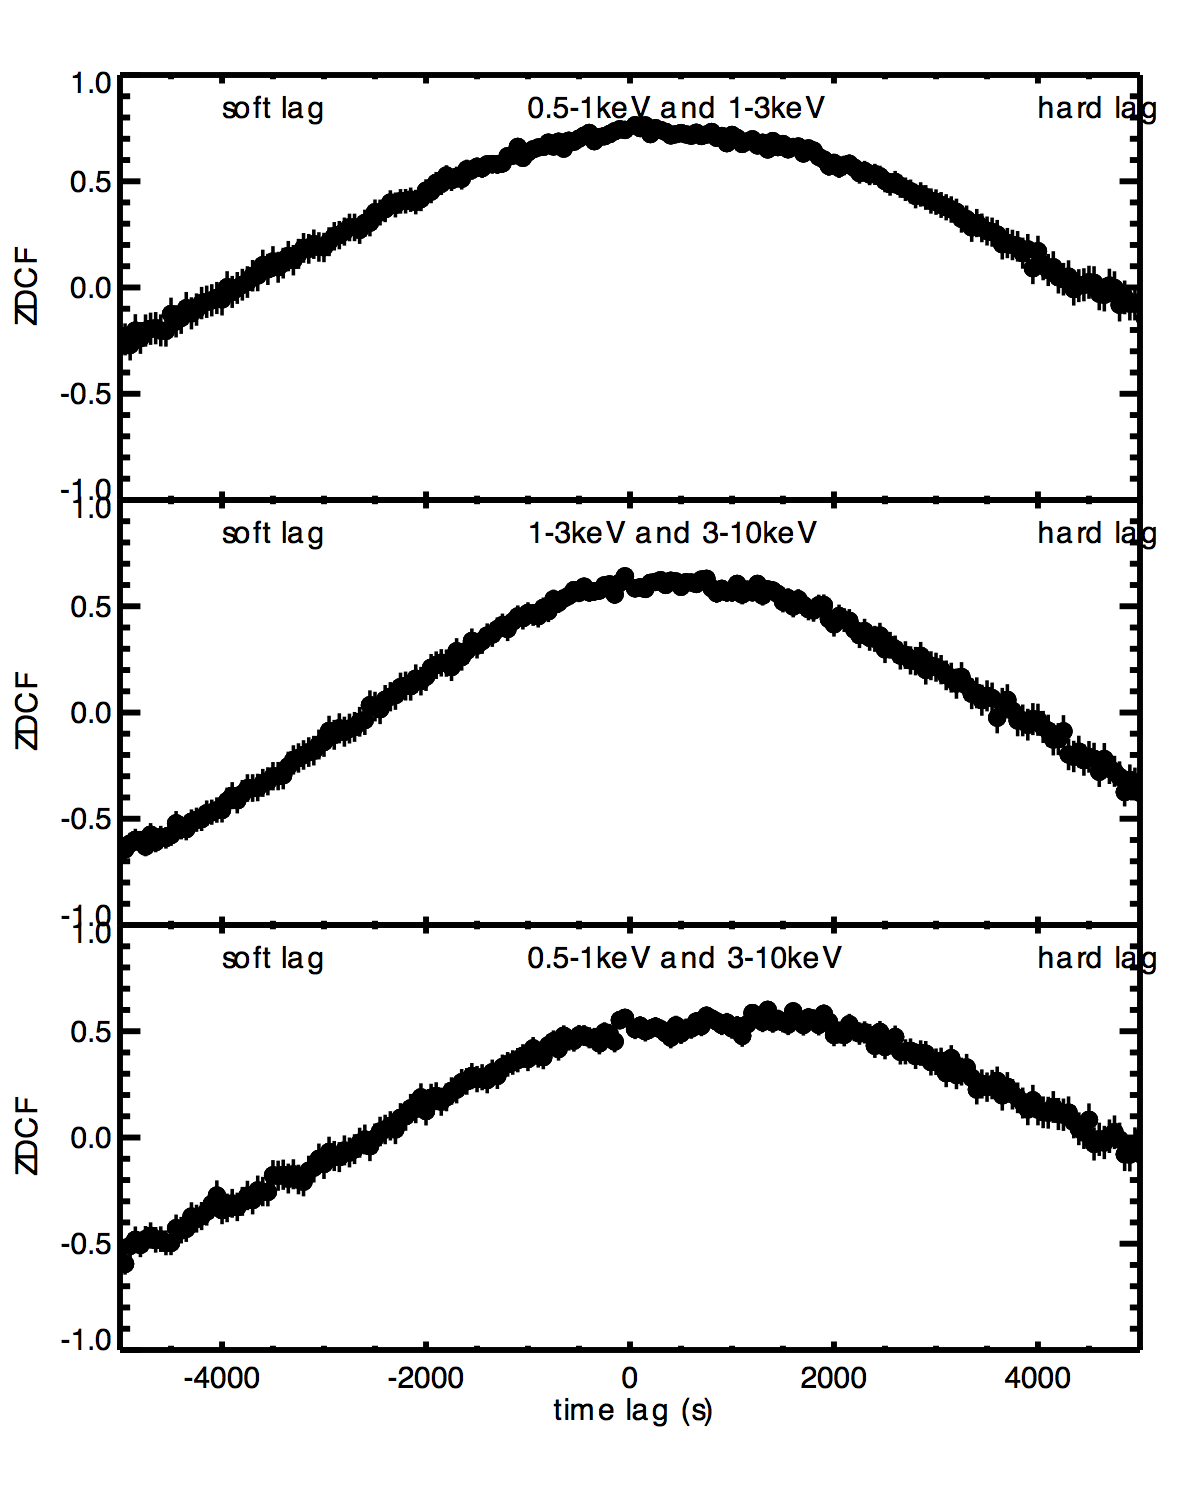
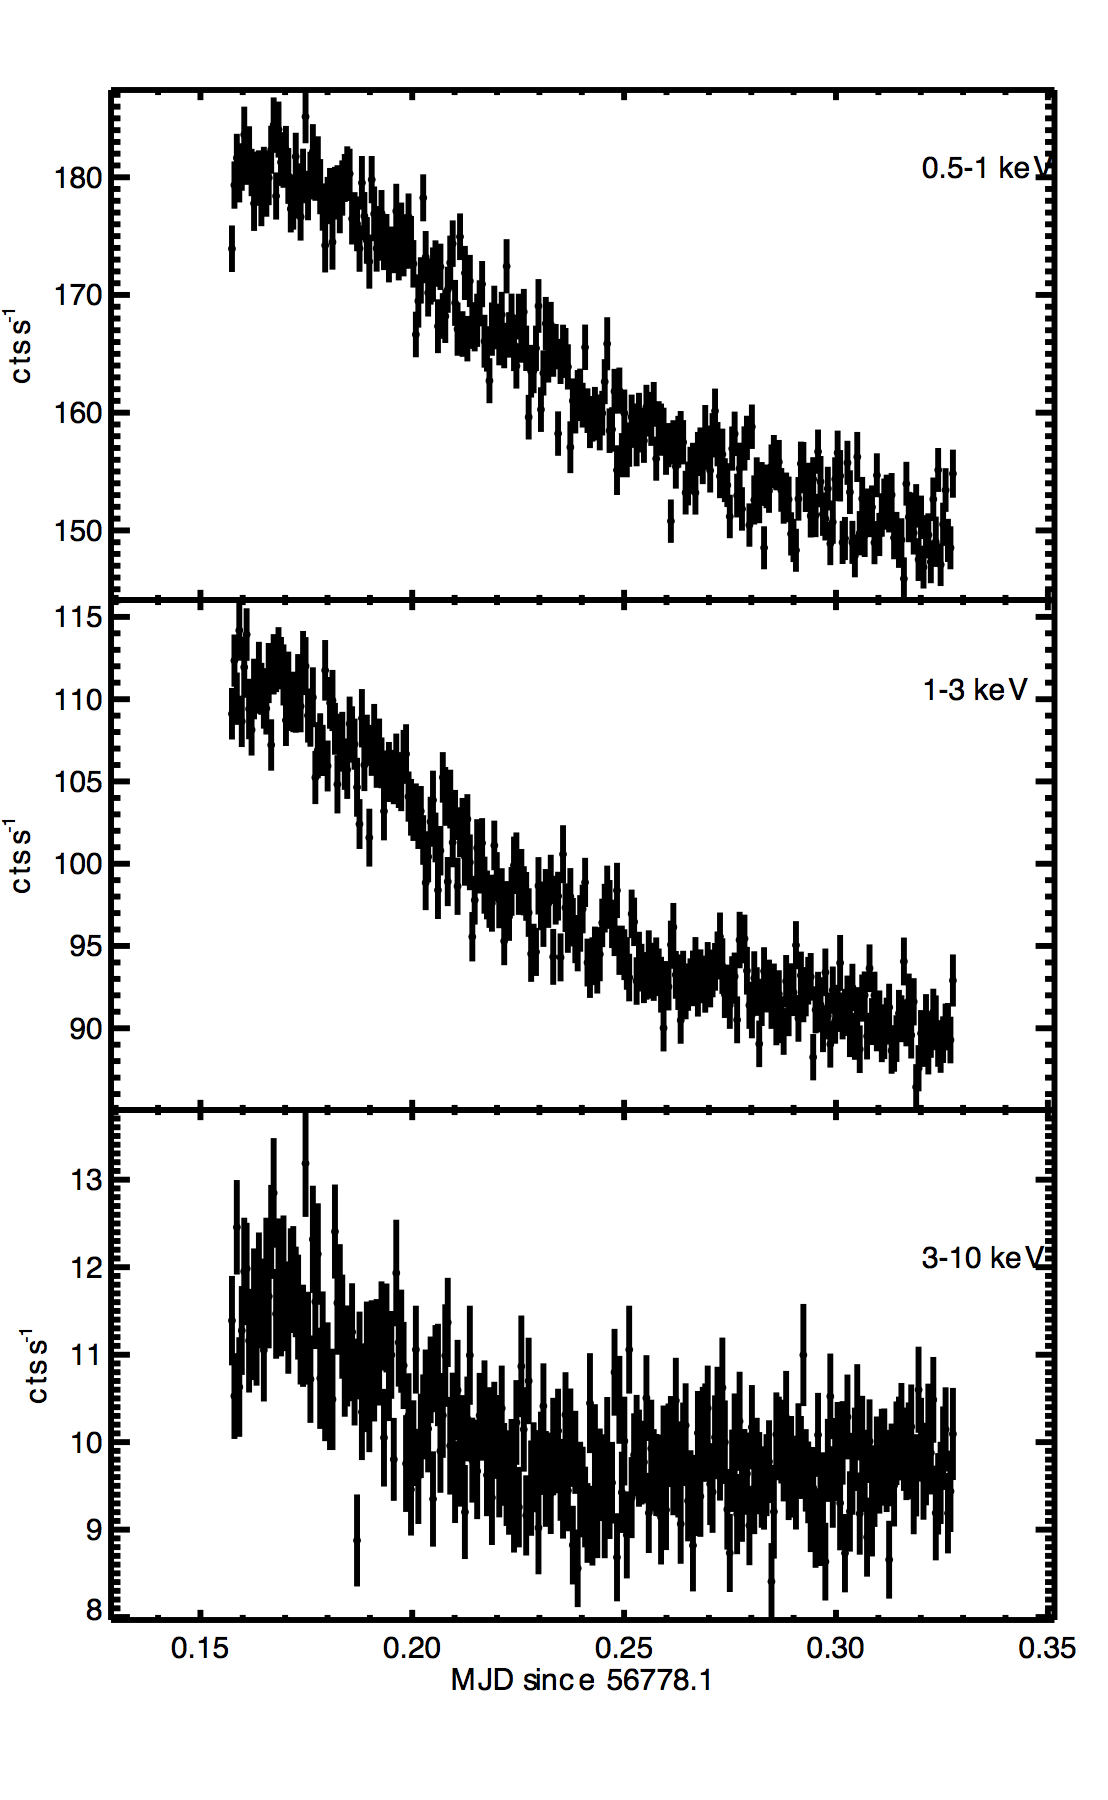
Figure 9: Left panel: Light curves of Mrk 421 observed with XMM-Newton-EPN on 2014 May 3. Count rates binned in 50 s time intervals in three energy bands, 0.5-1 keV, 1-3 keV, and 3-10 keV, are shown from top to bottom panel, respectively. Right panel: the ZDCF between these three X-ray bands. Positive lag values indicate "hard lag".
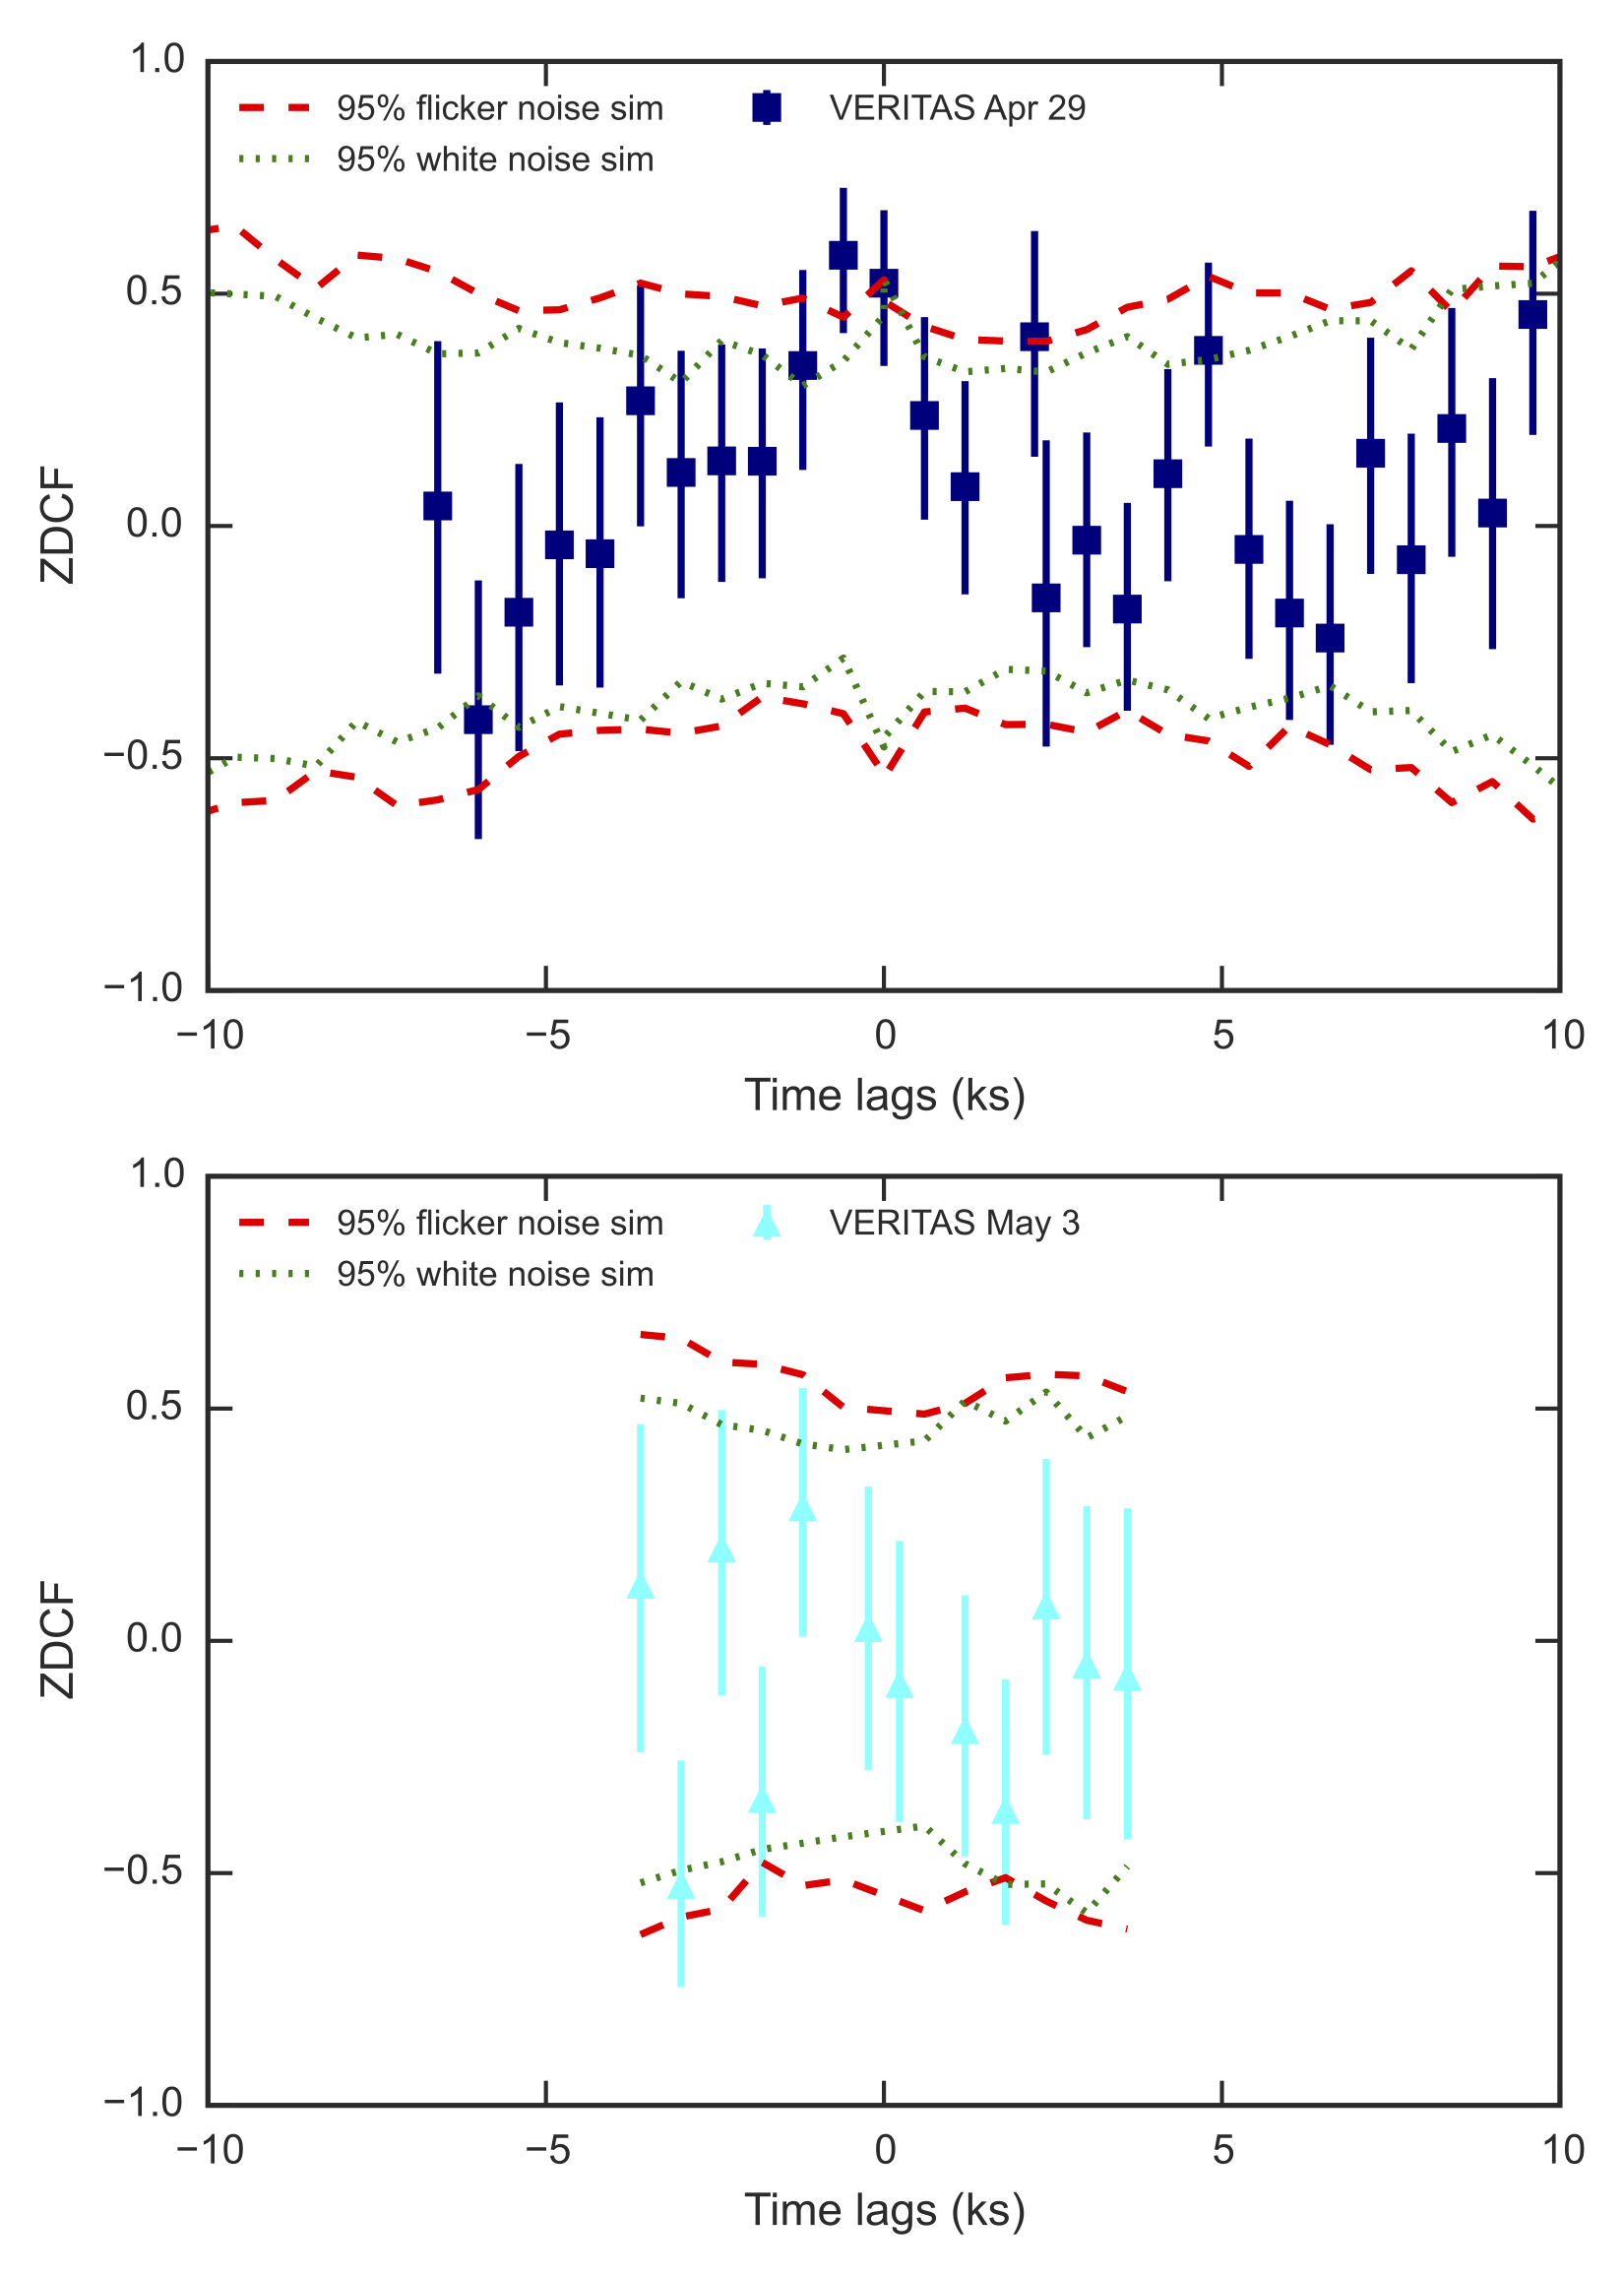
Figure 10: VERITAS ZDCFs between light curves integrated below and above 560 GeV of Mrk 421 on 2014 Apr 29 and May 3. The 95% coin cidence region from flicker noise and white noise simulations are shown as red dashed lines and green dotted lines, respectively.
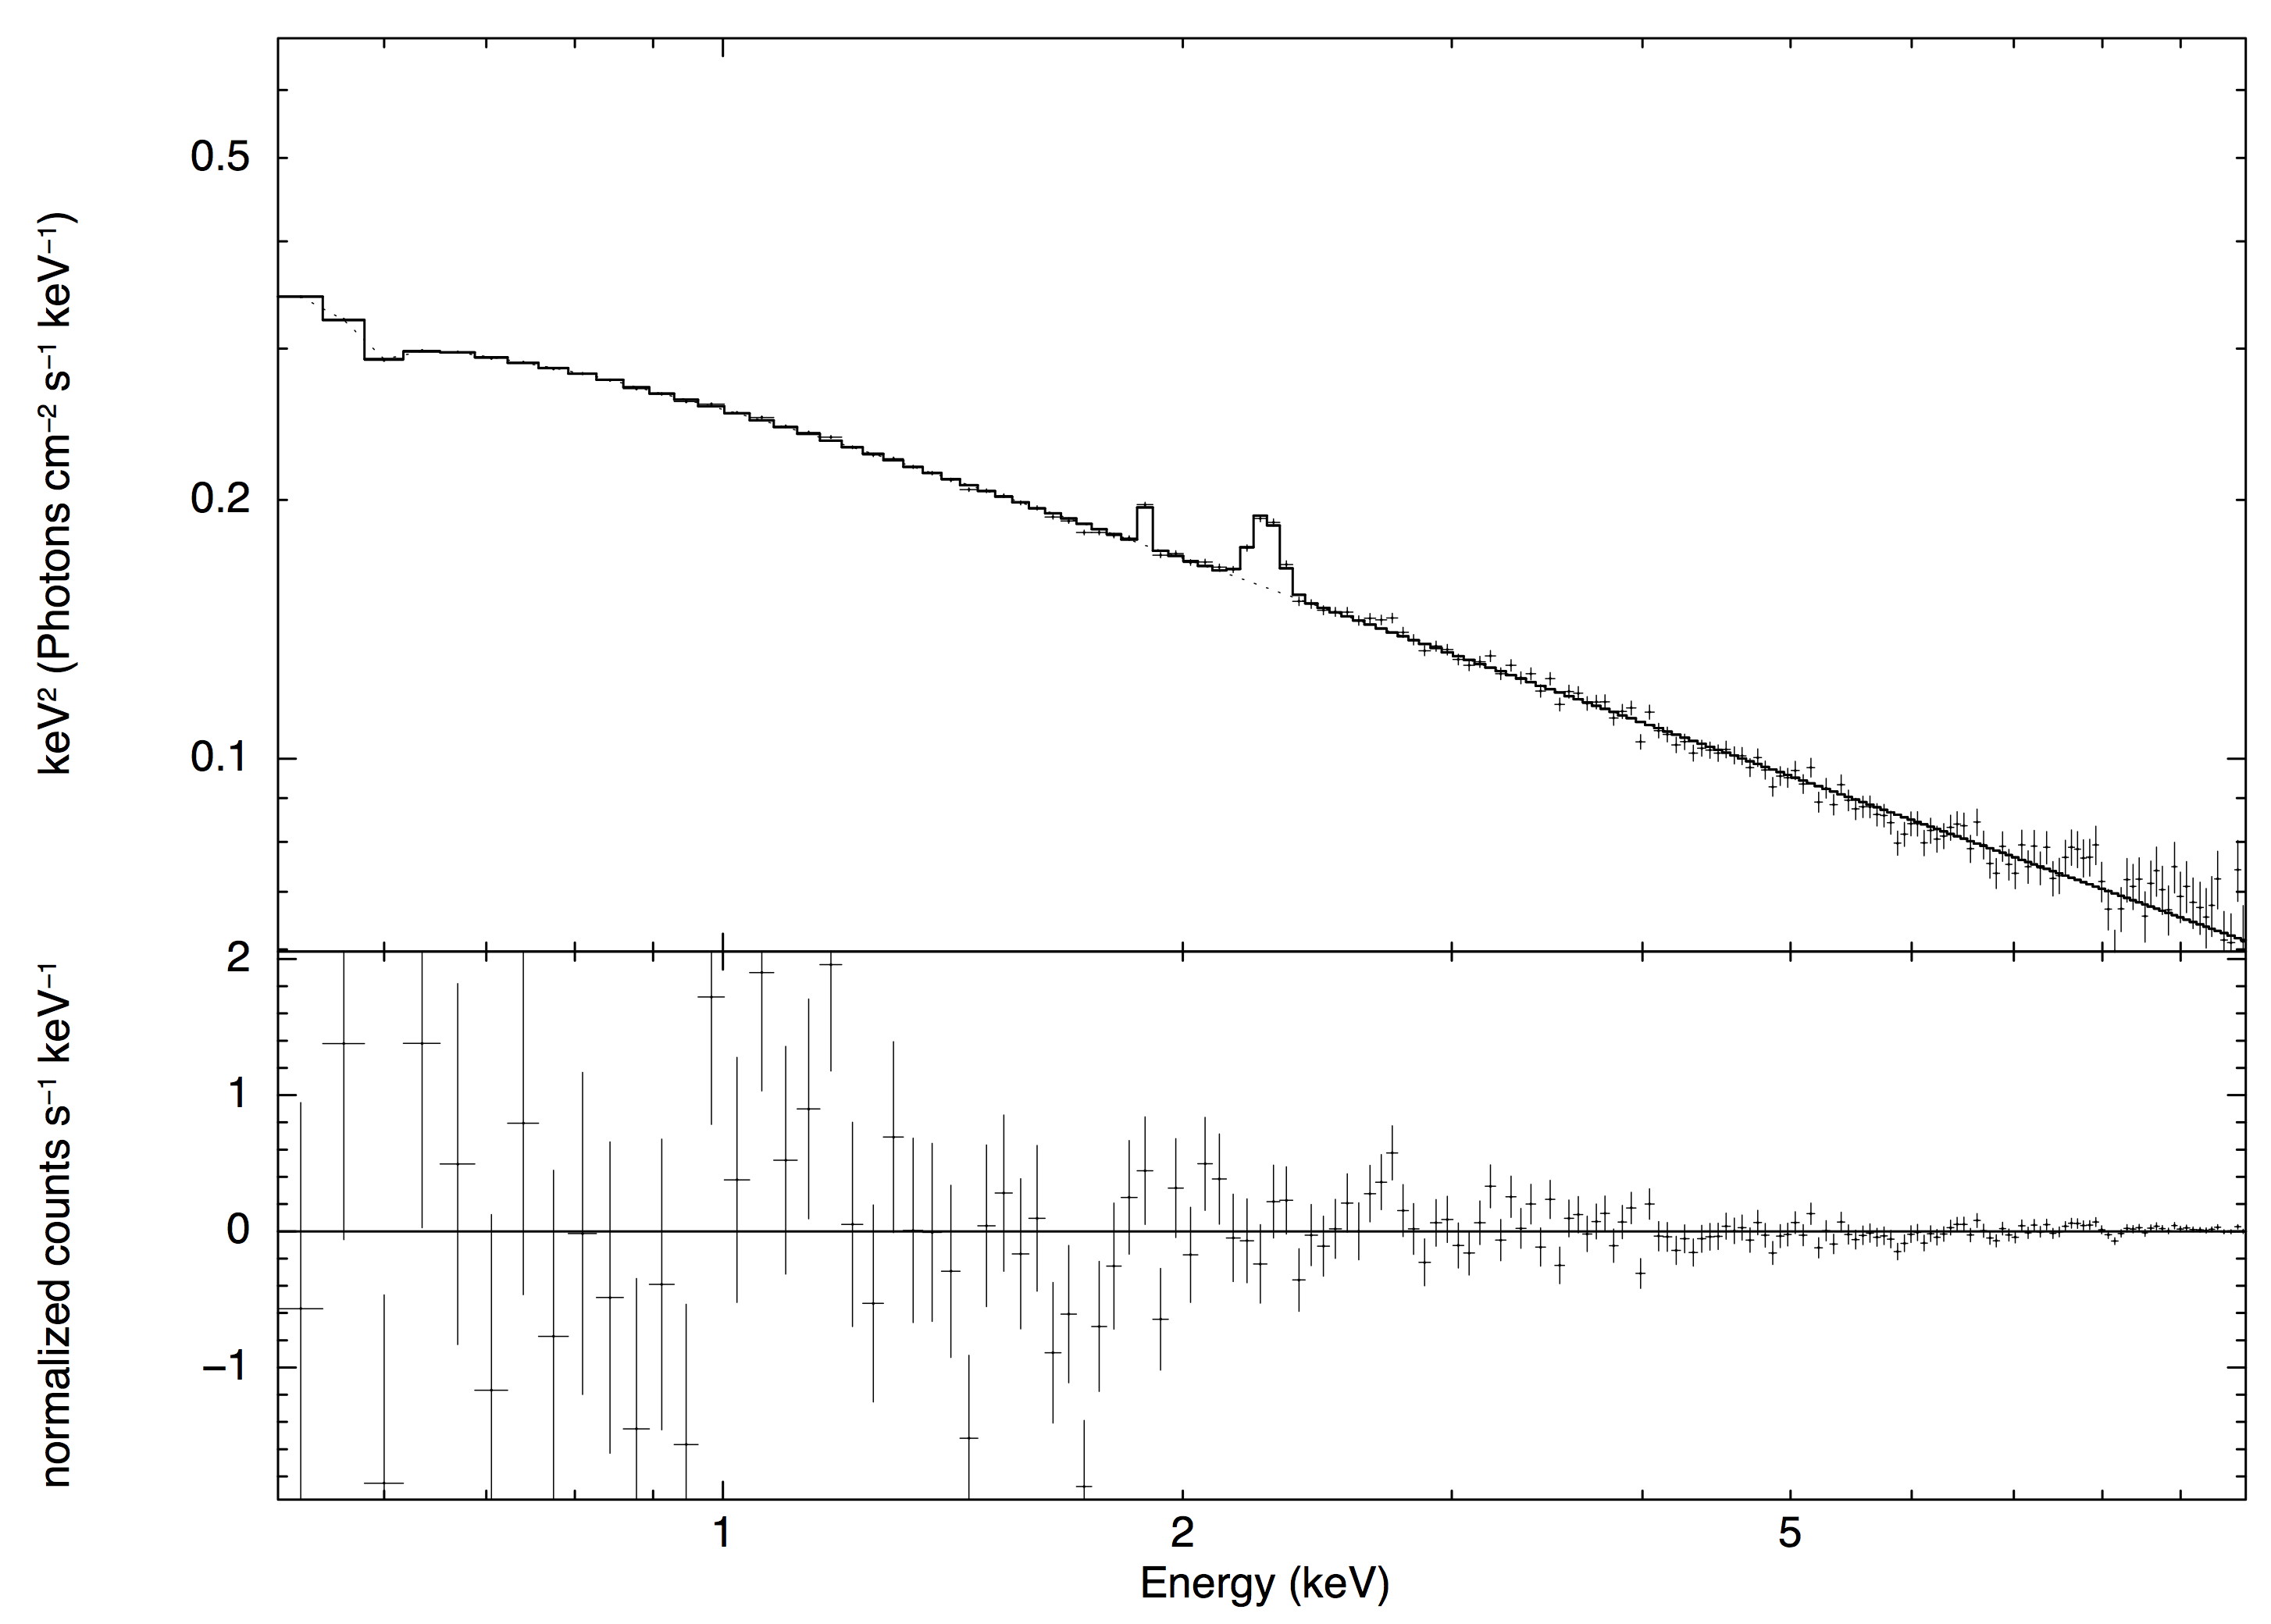
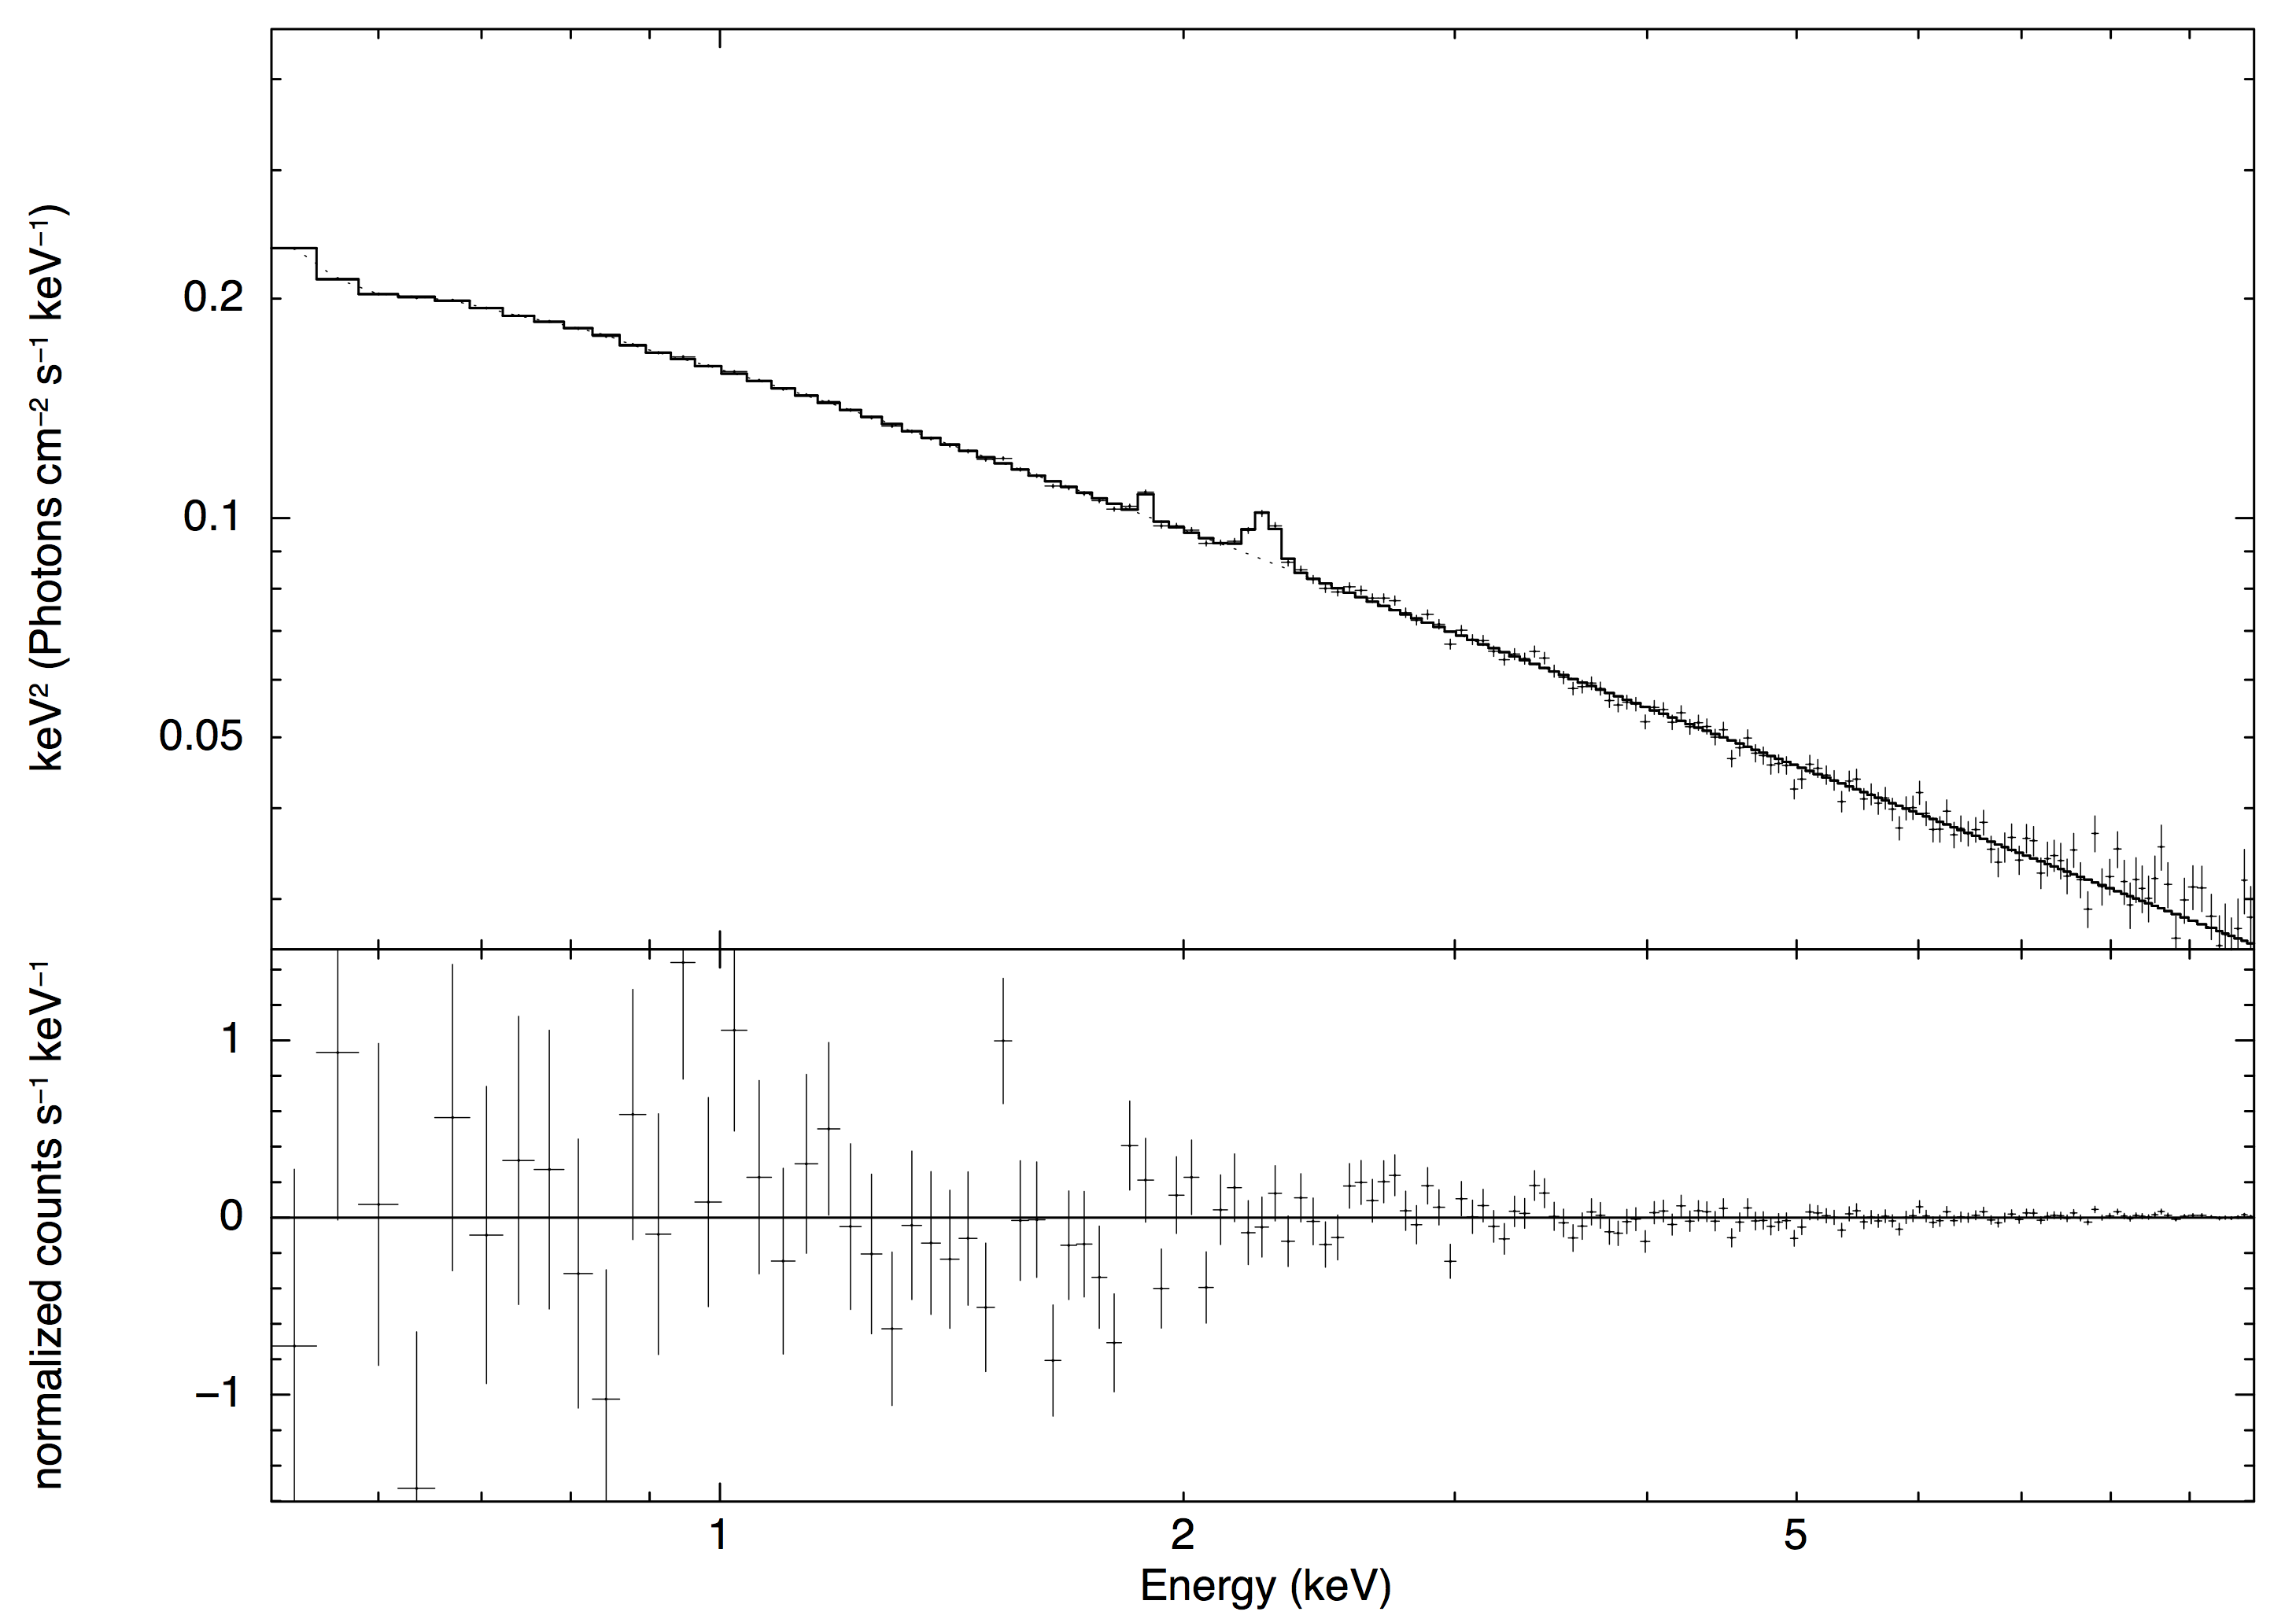
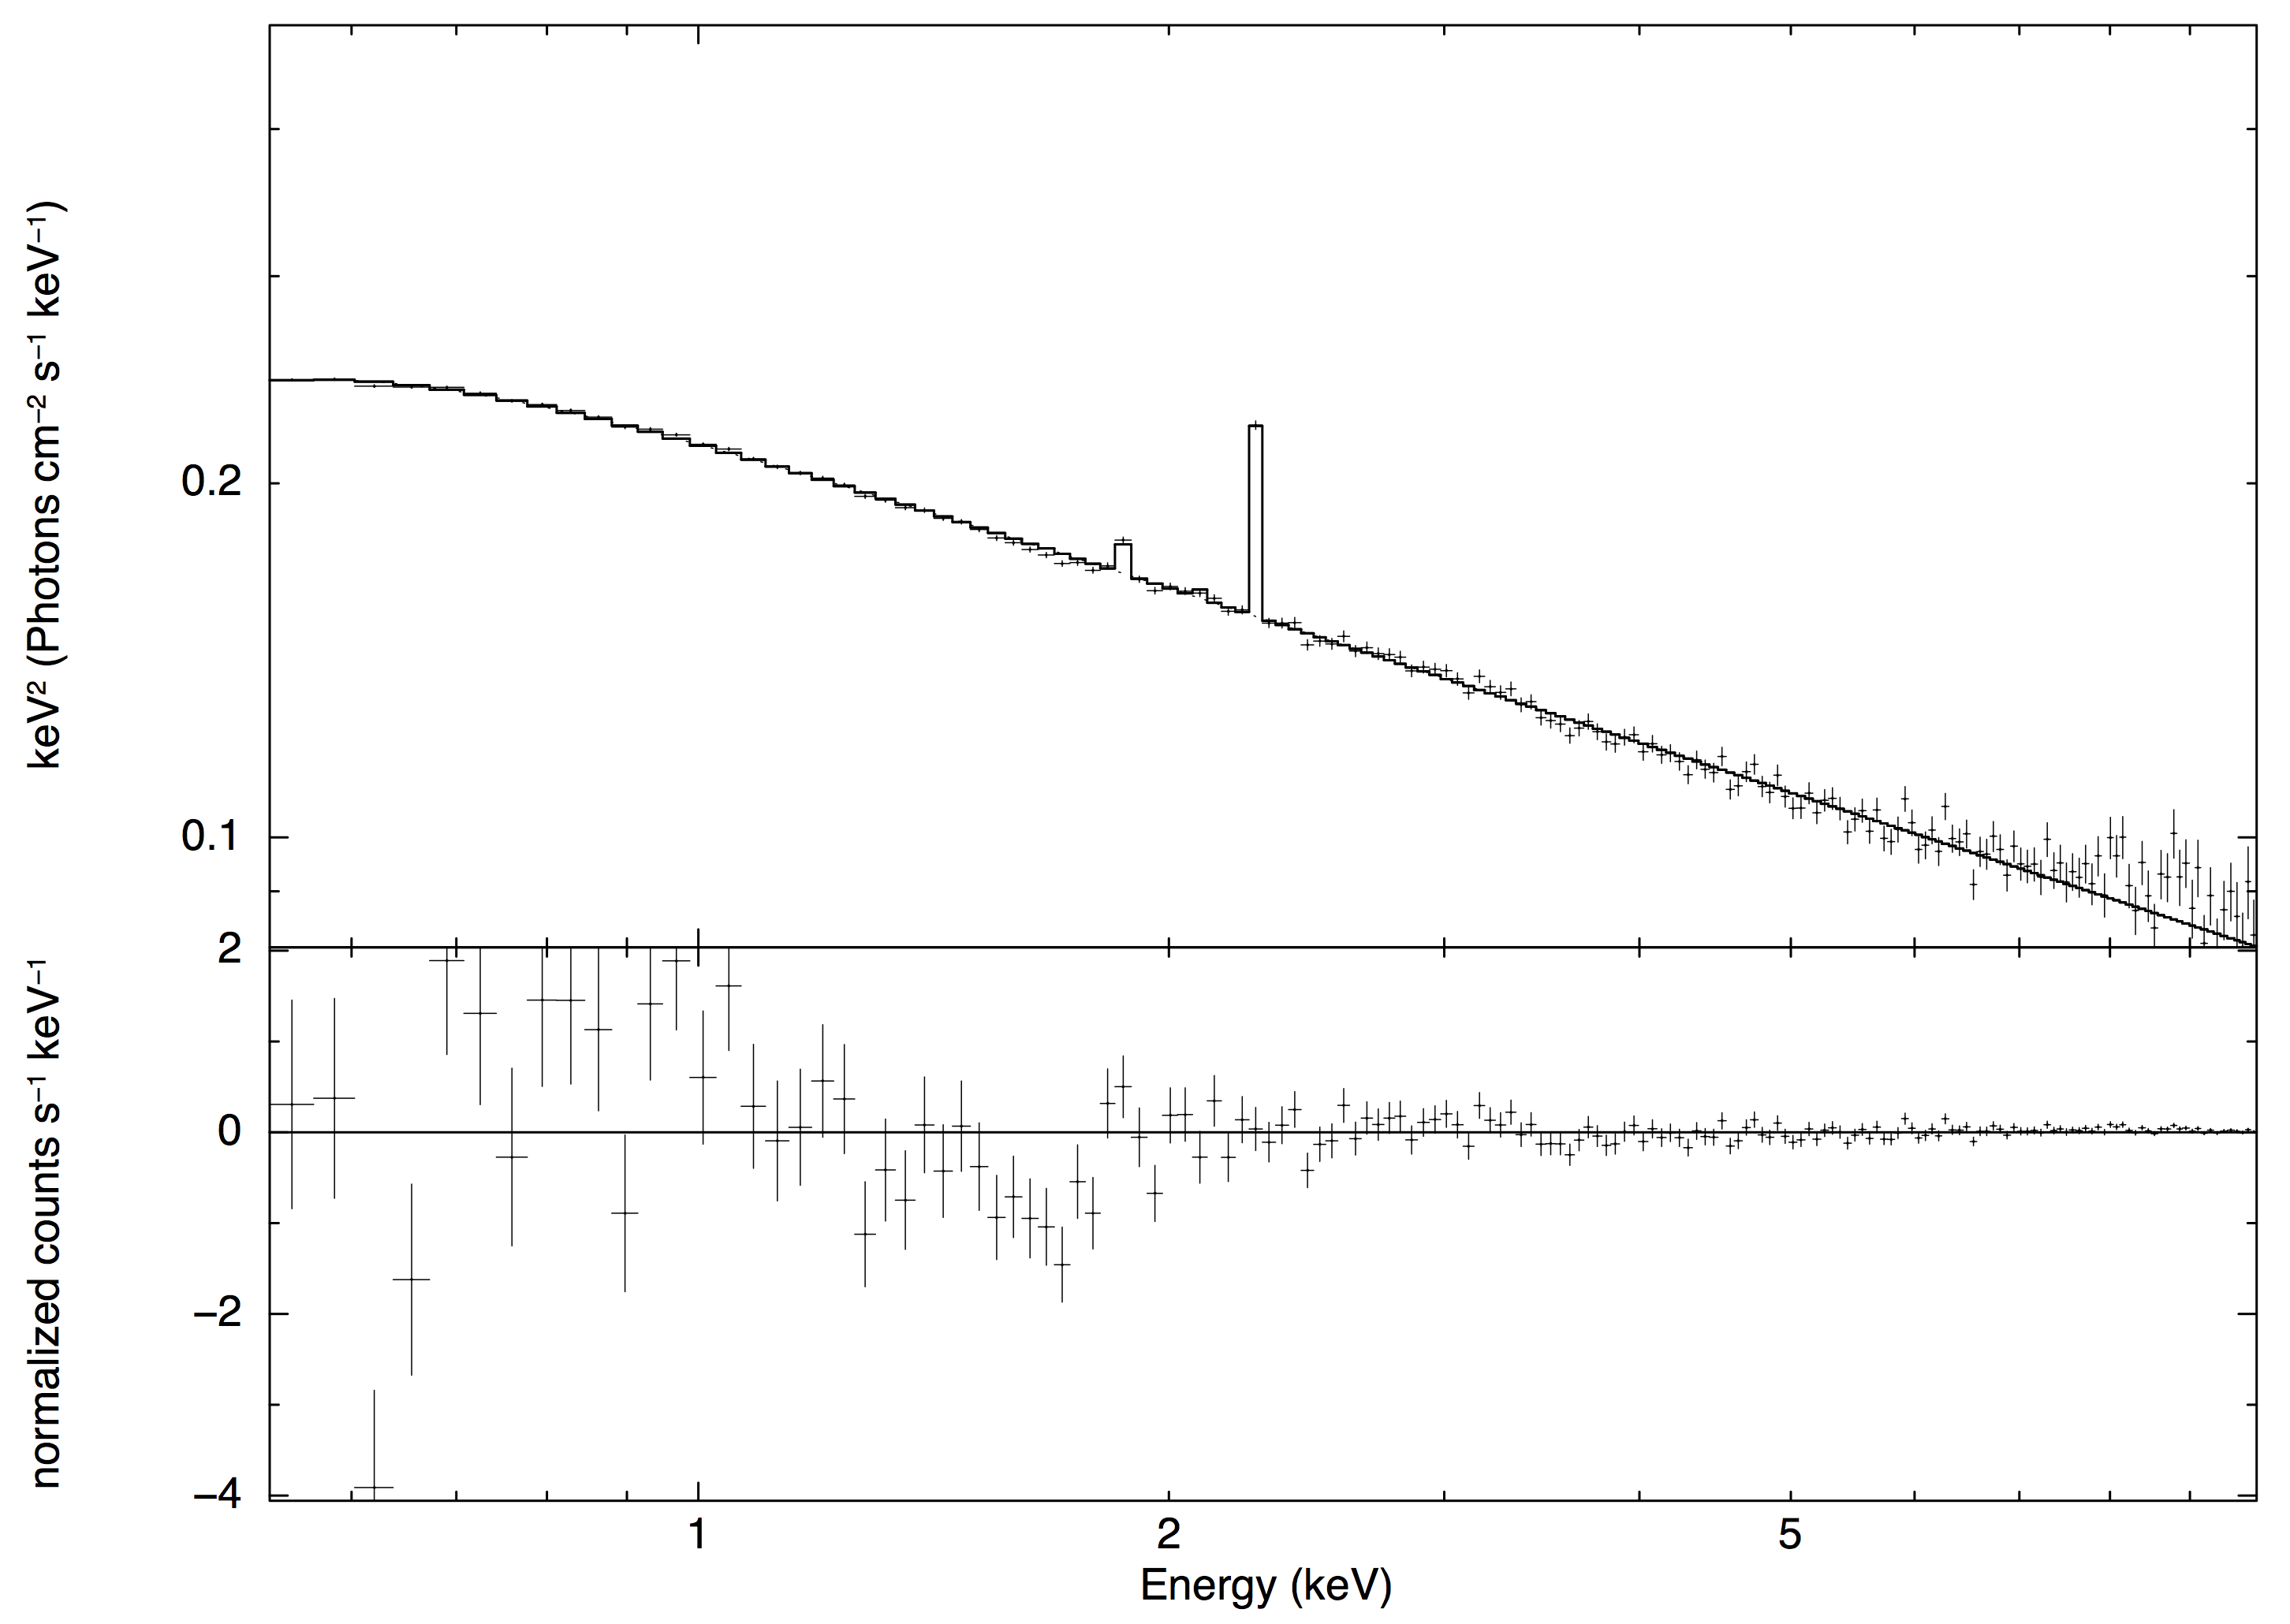
Figure 11: X-ray spectra of Mrk 421 measured by XMM-Newton-EPN from the three simultaneous ToO observations in 2014. The spectra are fi tted with a power law plus absorption model accounting for the source, and multiple instrumental features (see text and Table 4 for details).
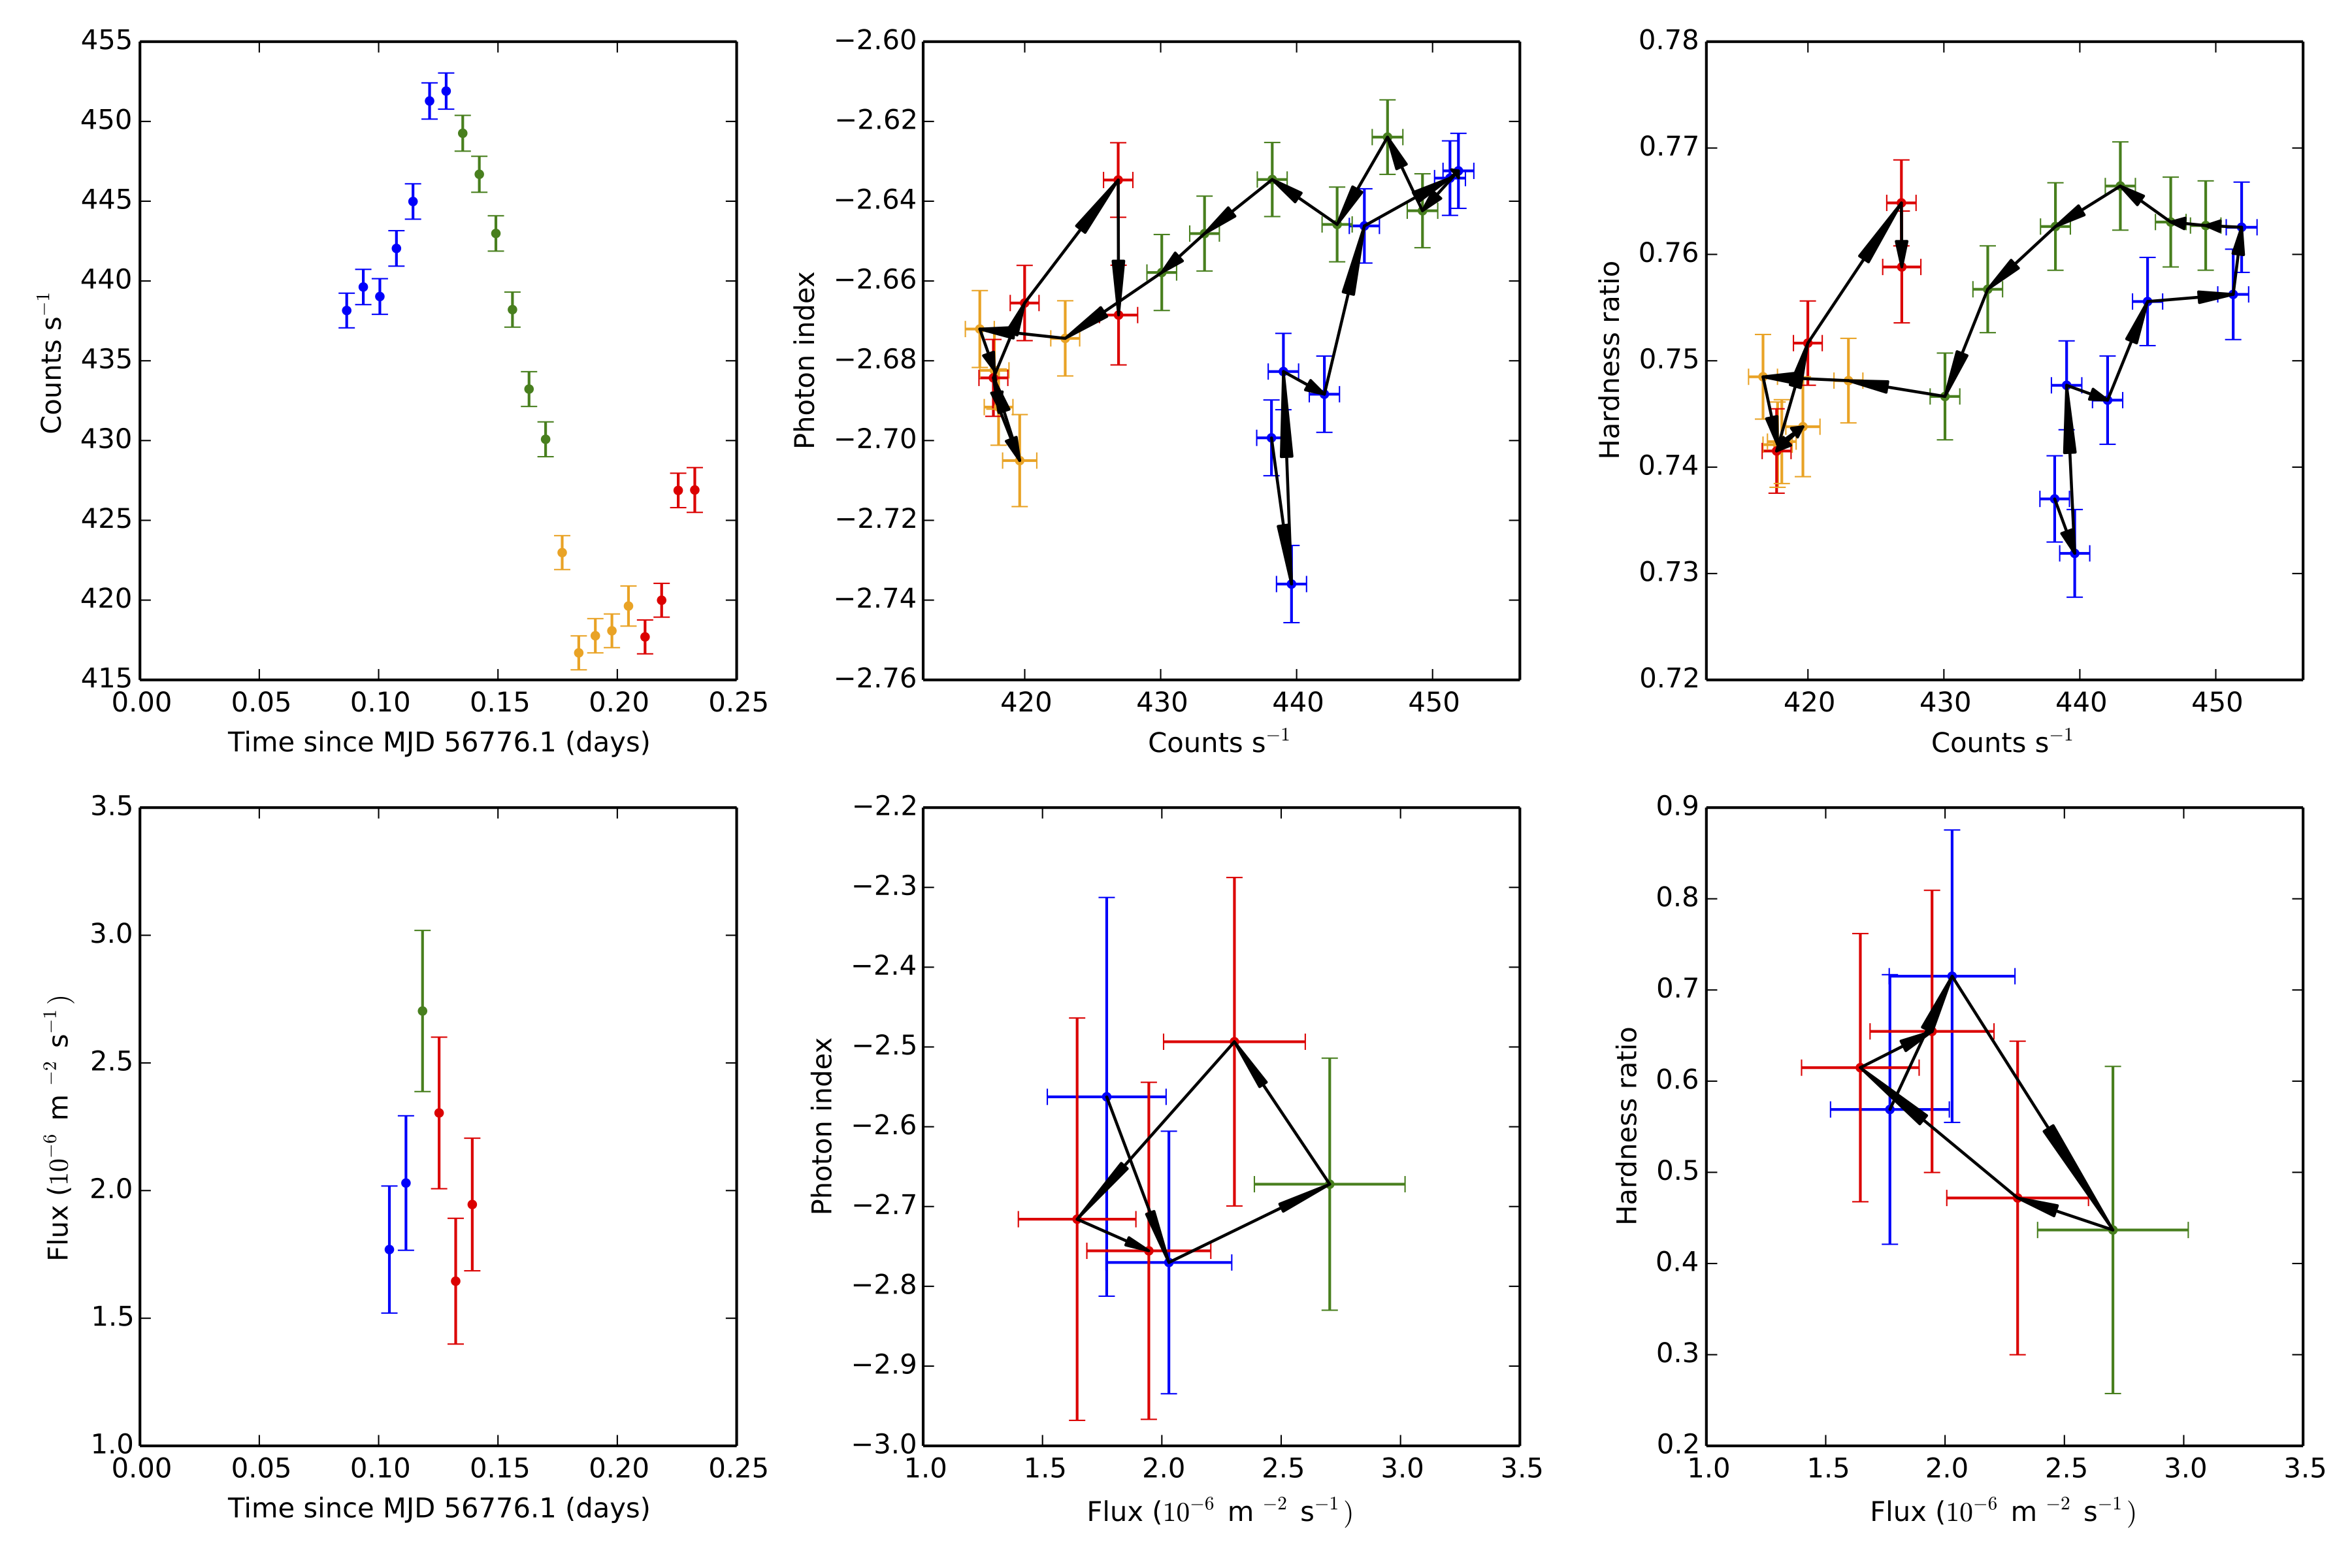
Figure 12: Spectral hysteresis of Mrk 421 on 2014 April 29. The top and bottom rows show results from X-ray and TeV observations, respectively. In each row, the left plot shows a light curve segment that contains a bump in flux, the middle plot shows the relationship between flux (counts) and best-fi t photon index, and the right plot shows the relationship between flux (counts) and the hardness ratio. Each point of flux, HR, and index measurements is from a 10-min interval. The hardness ratio for X-ray is the ratio between the count rates in 1-10 keV and 0.5-1 keV; and for VHE between 560 GeV-30 TeV and 315-560 GeV. Black arrows and di fferent colors are used to guide the eye as time progresses.
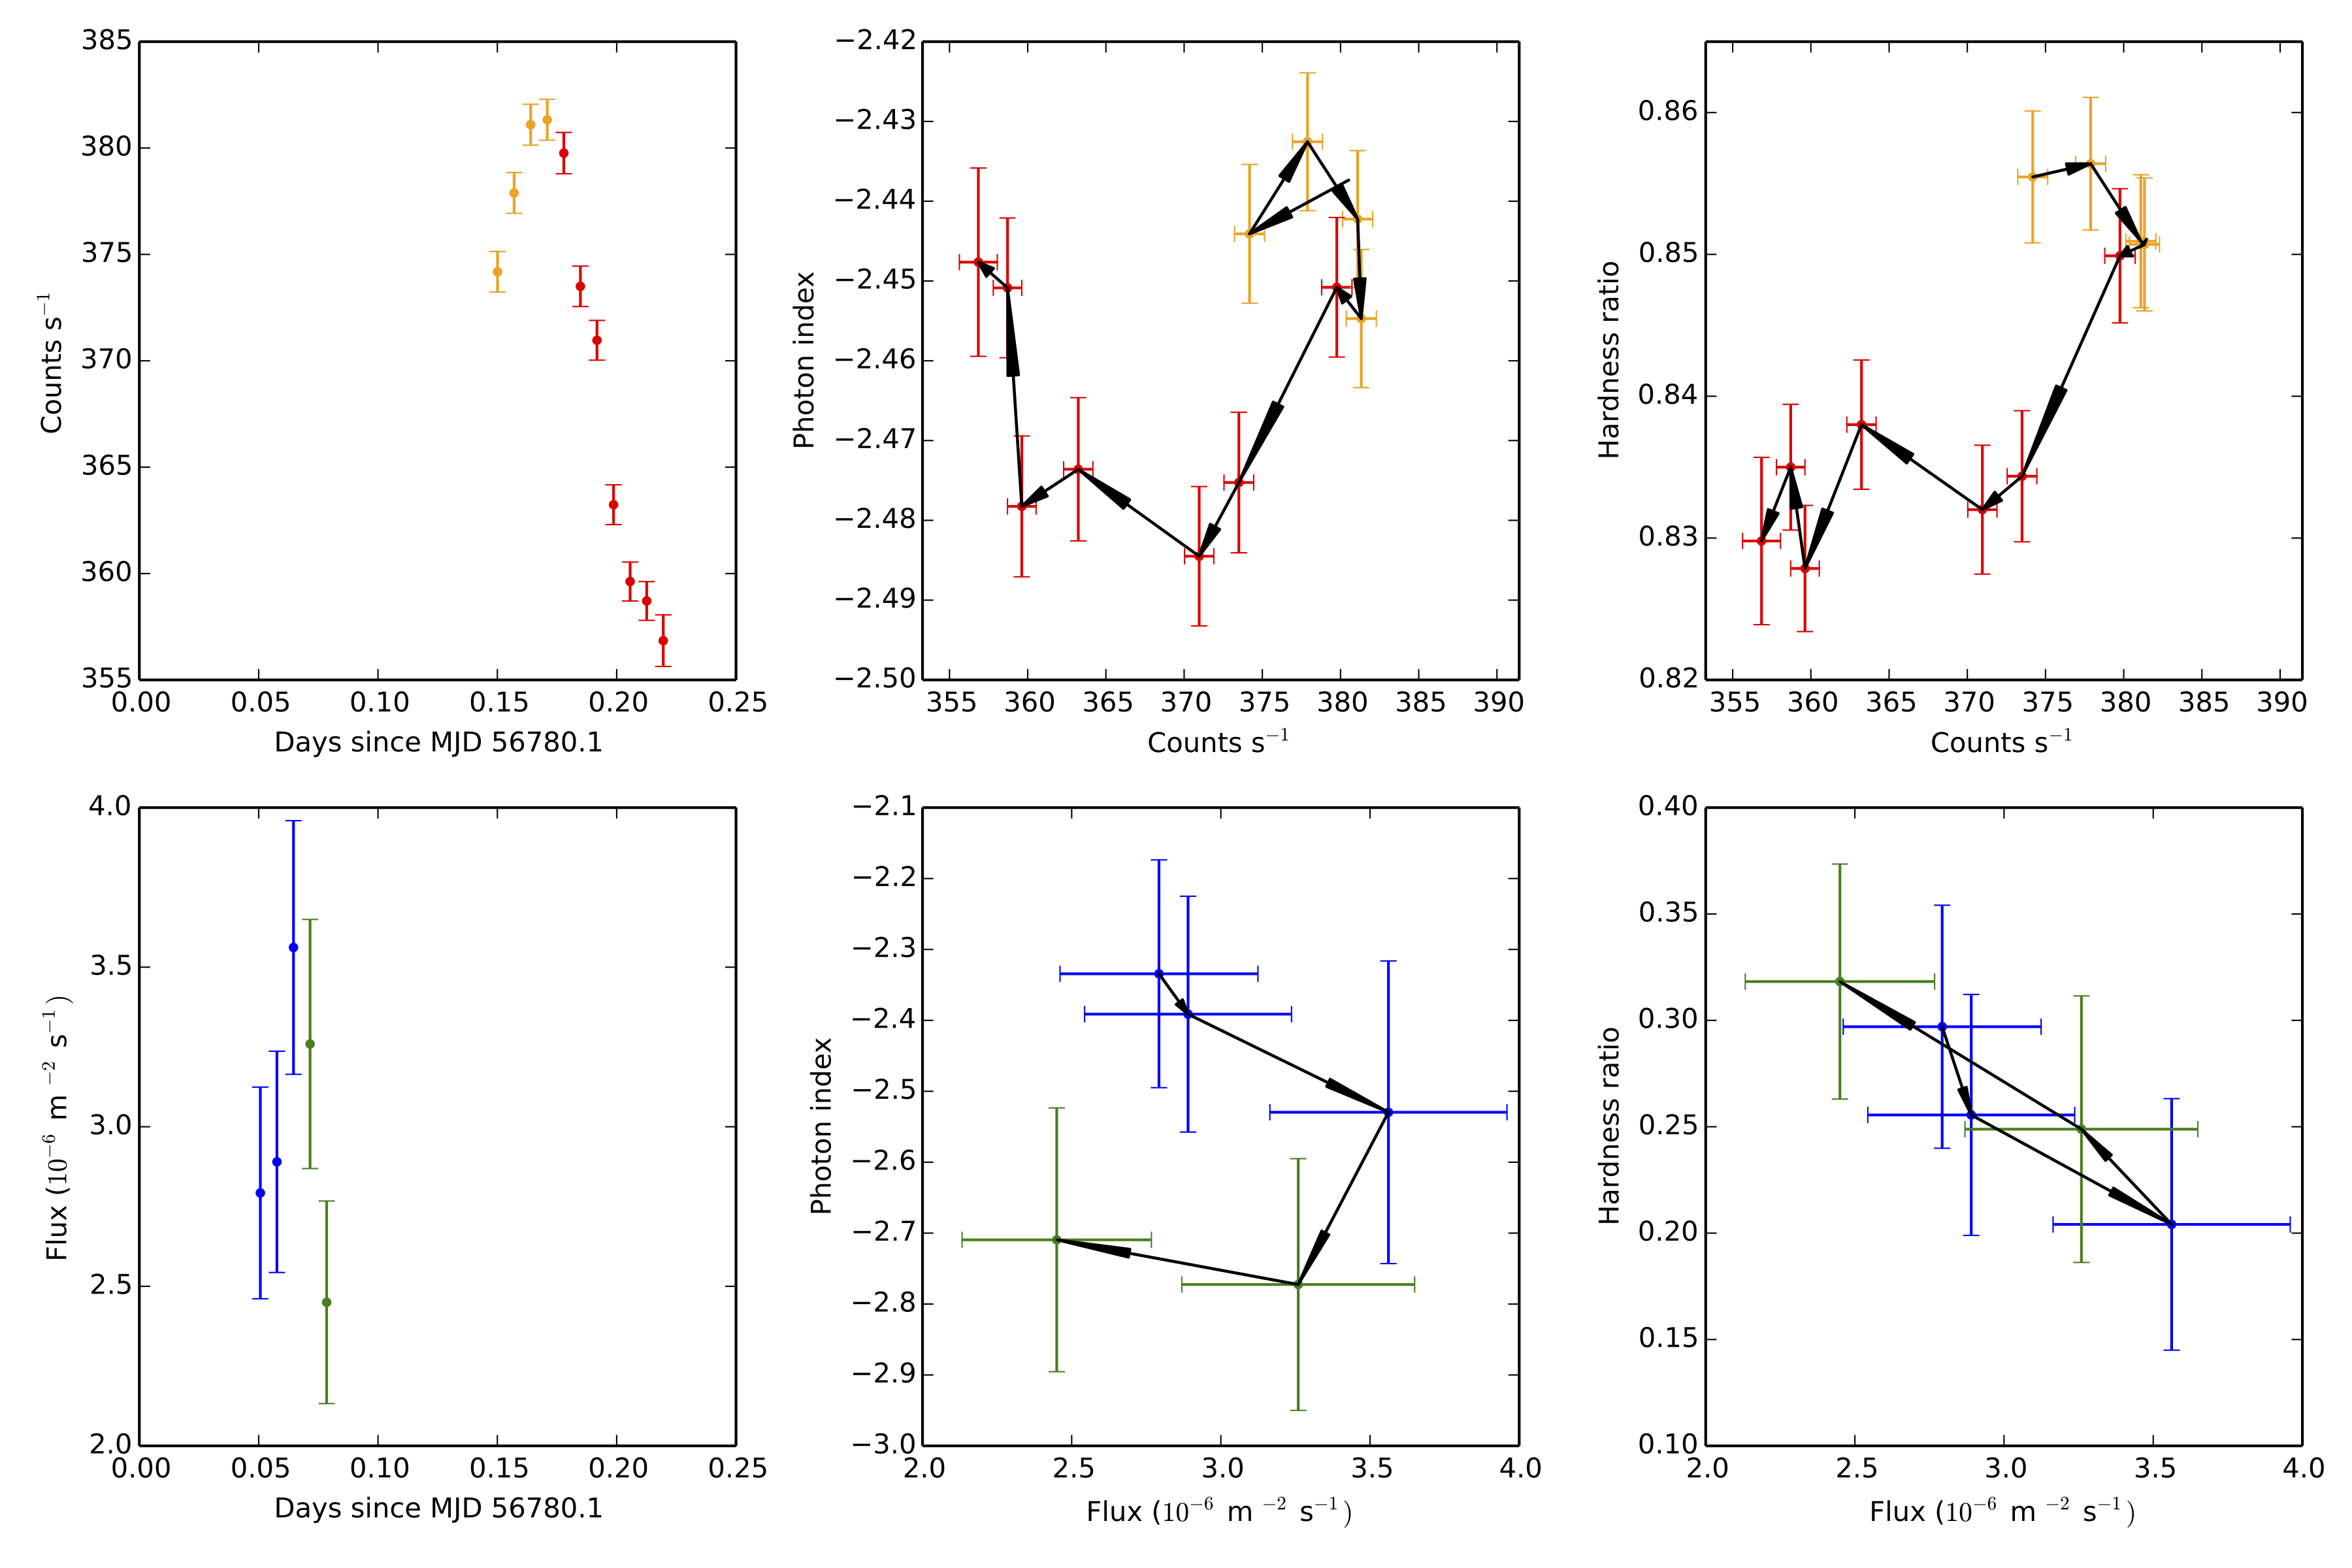
Figure 13: Spectral hysteresis of Mrk 421 on 2014 May 3. The top and bottom rows show results from X-ray and TeV observations, respectively. In each row, the left plot shows a light curve segment that contains a bump in flux, the middle plot shows the relationship between flux (counts) and best-fi t photon index, and the right plot shows the relationship between flux (counts) and the hardness ratio. Each point of flux, HR, and index measurements is from a 10-min interval. The hardness ratio for X-ray is the ratio between the count rates in 1-10 keV and 0.5-1 keV; and for VHE between 560 GeV-30 TeV and 225-560 GeV. Black arrows and diff erent colors are used to guide the eye as time progresses.
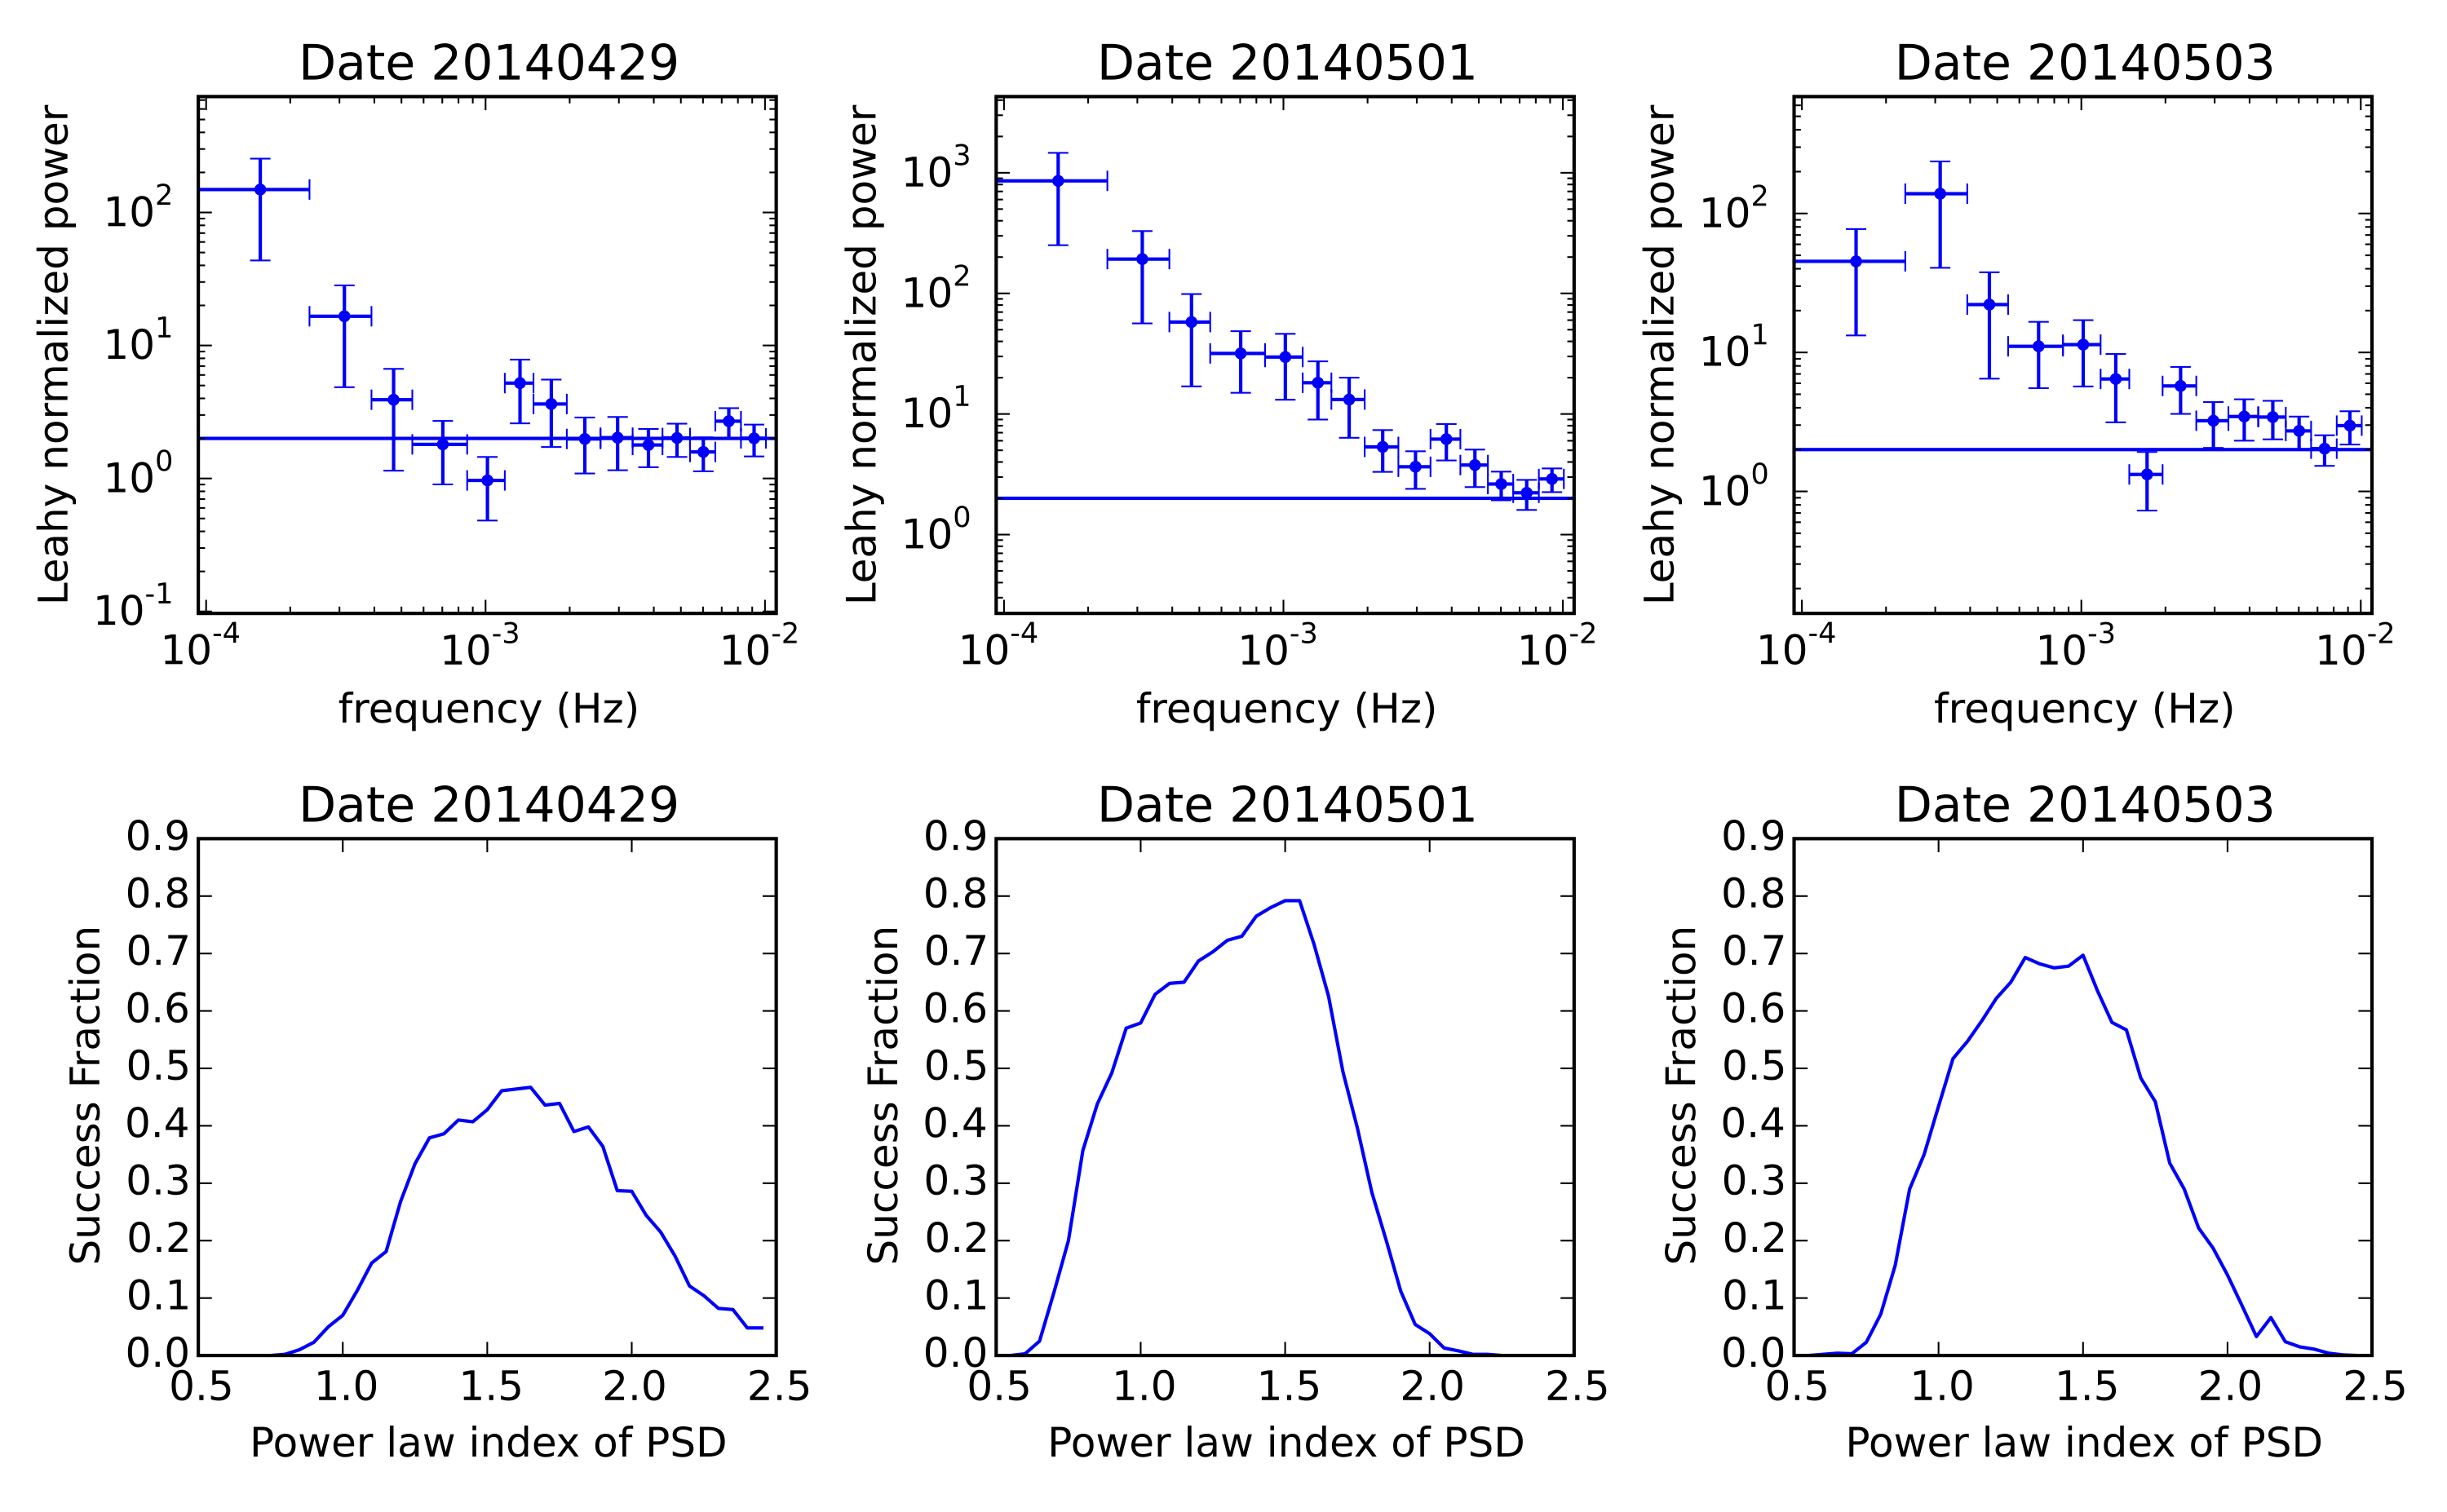
Figure 14: The PSD distributions (top row) and success fraction results (bottom row) of Mrk 421 calculated from the XMM-Newton-EPN observations in 2014. The power spectra are averaged over two segments of light curves each with 128 bins, and then rebinned geometrically in frequency space with a step factor 1.2. The PSDs are Leahy normalized, and the flat lines indicate the power of Poisson noise. The SuF results are calculated from comparisons between data and simulated light curves assuming an underlying PSD that follows a power-law distribution, the index of which goes from 0.5 to 2.5 in 0.05 steps. The highest frequencies (> 2x10⁻³ Hz, > 7x10⁻³ Hz, and > 3x10⁻³ Hz on Apr 29, May 1, and May 3, respectively) are excluded when calculating the SuF to get rid of the bias caused by white noise. One thousand simulated light curves are generated at each index.
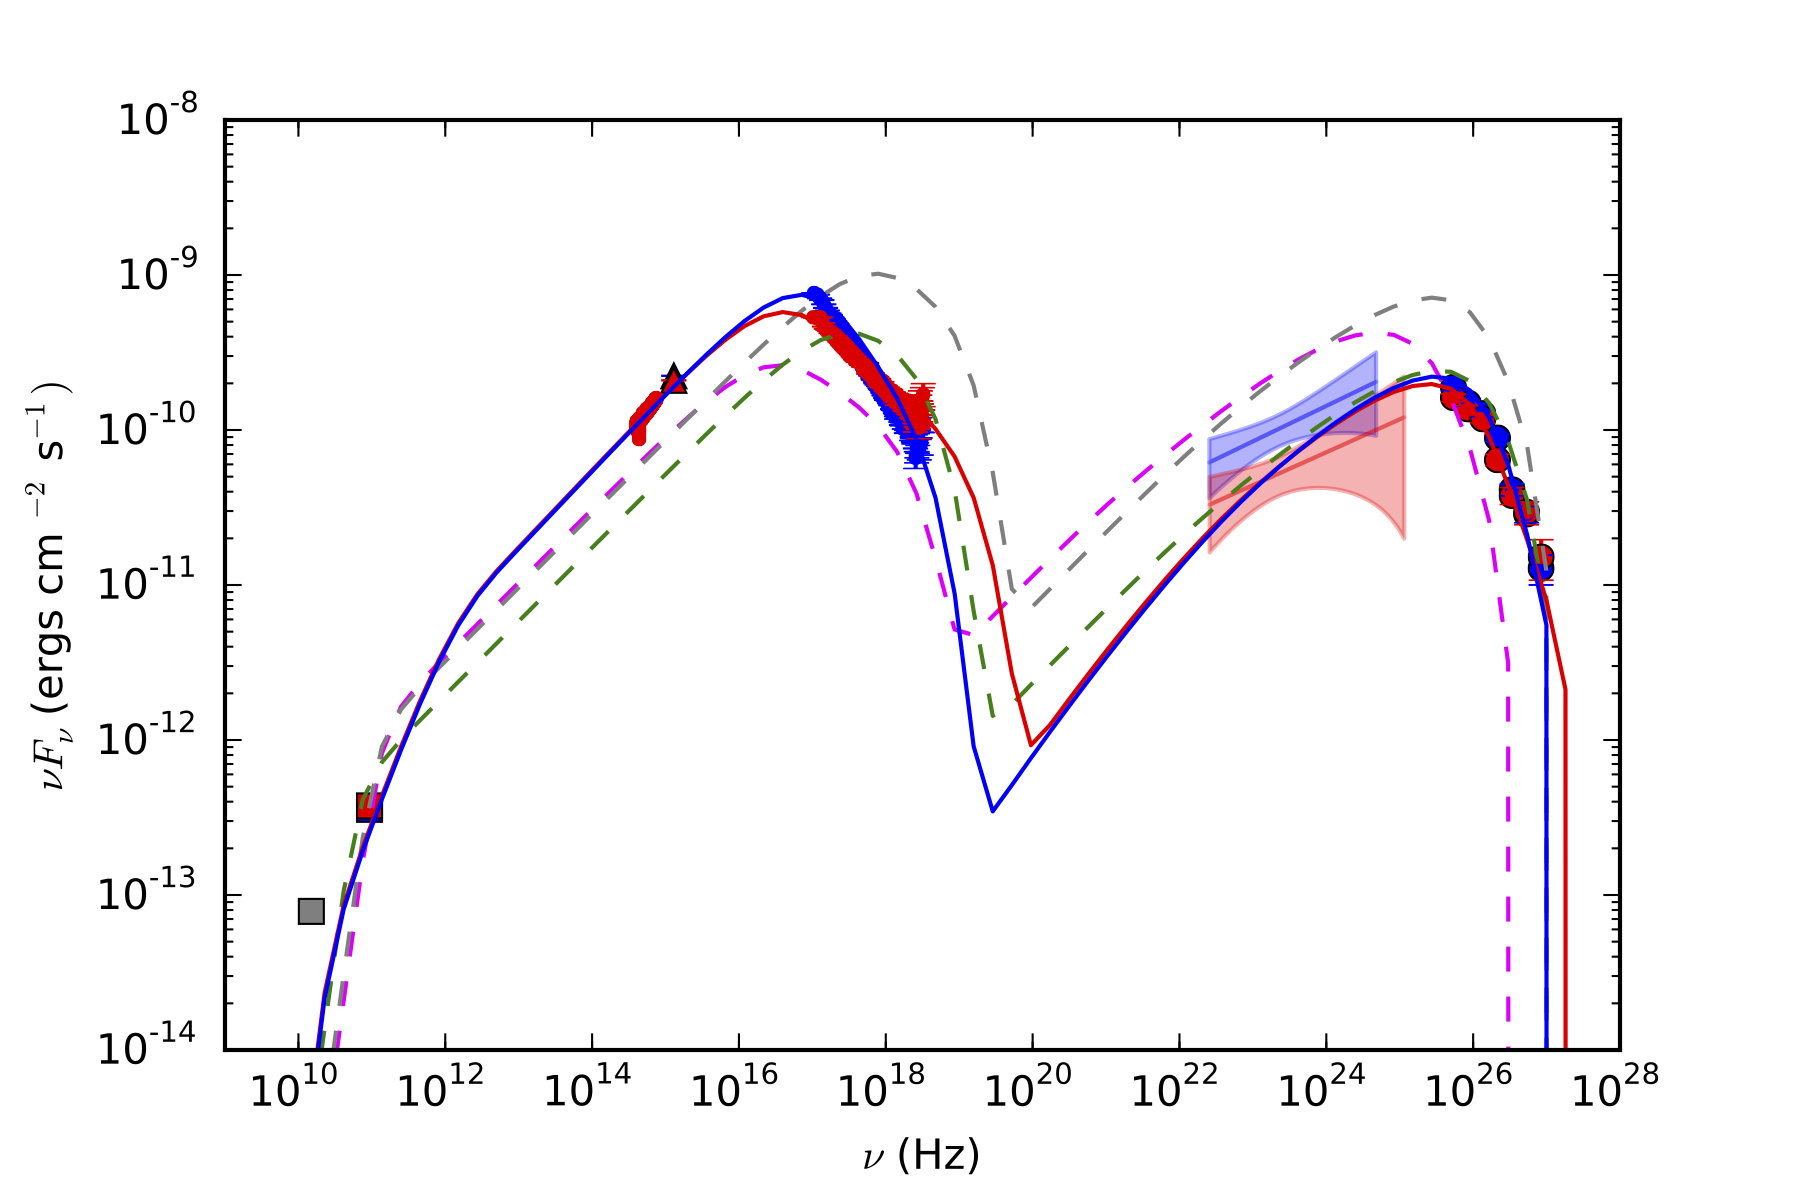
Figure 15: Broadband SED of Mrk 421 on 2014 April 29 (shown in blue) and May 3 (shown in red). From higher frequencies to lower ones, filled circles show VERITAS data, butterfly regions show Fermi-LAT data averaged over one day, round dots and triangles show XMM-Newton-EPN and OM data, respectively, small dots show Steward Observatory data (only on May 3, with host galaxy subtracted), and squares show CARMA and OVRO data. See text for details of the measurements and the SSC models shown. The results from previous observations are also shown for comparison: the gray, green, and magenta dashed lines correspond to models used for high, medium, and low flux as described in B la_zejowski et al. (2005).