
Energy spectra of 1ES 1218+30.4 from the observation campaign described in this paper. See Figure 8 for more details.
Reference: S. Archambault et al. (The VERITAS Collaboration), Astrophysical Journal 788: 158, 2014
Full text version
ArXiv:
Contacts: Henric Krawczynski
This paper describes observations of the supermassive black hole 1ES1218+30.4 with the VERITAS gamma-ray telescope array (Mount Hopkins, AZ) as well as with a suite of telescopes observing at other (longer) wavelengths of the electromagnetic spectrum. The observations are used to constrain the opacity of the universe to gamma-rays. This is done by detailed modeling of the observations at longer wavelengths combined with a comparison of the predicted gamma-ray energy spectrum with the observed one. The discrepancy between latter energy spectra (or the lack thereof) can be used to constrain how many gamma-rays were absorbed by intergalactic photon-photon interactions.
FITS files:
Figures from paper (click to get full size image):
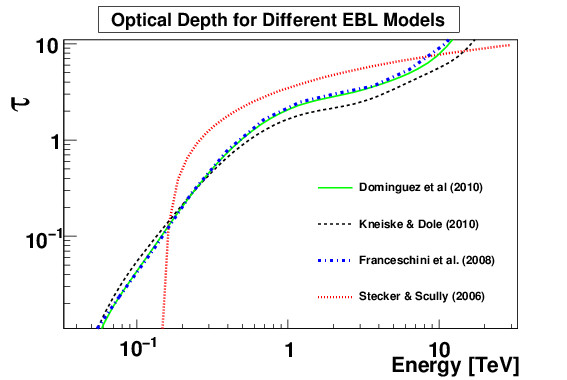
Figure 1: Optical depth τΥ(ε,z = 0.182) for VHE gamma rays coming from 1ES 1218+30.4 as function of the observed energy of the gamma rays ε for the four different EBL models utilized in this study.
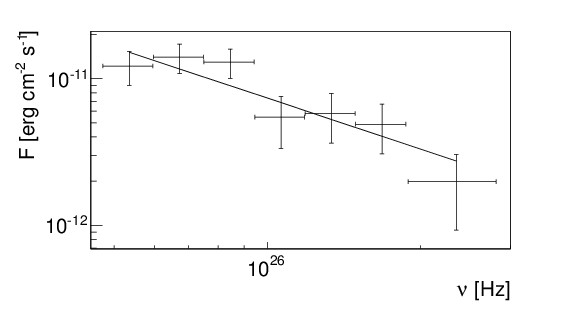
Figure 2: Gamma-ray energy spectrum of 1ES1218+30.4 measured with VERITAS during the observation campaign. The 1 TeV energy flux is (2.6±0.7)x10−12 erg cm−2 s−1 and the photon index is Γ =3.14±0.22.
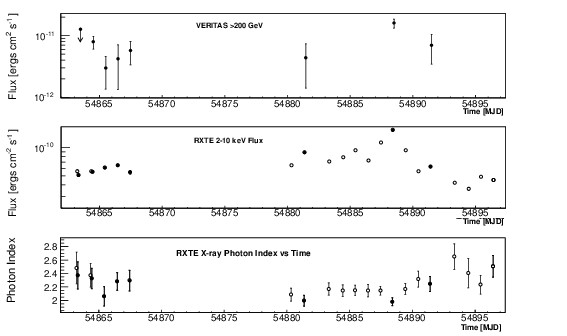
Figure 3: The top panel shows the >200 GeV γ-ray light curve measured with VERITAS, and the middle panel shows the 2 keV - 10 keV X-ray light curve measured with RXTE. The filled circles in the X-ray light curve highlight the RXTE observations which were simultaneously taken with the VERITAS observations. The lower panel shows the X-ray photon indices from fitting a power-law model to the 2 keV -10 keV data as a function of time. Note that the error bars on the RXTE fluxes are smaller than the symbols.
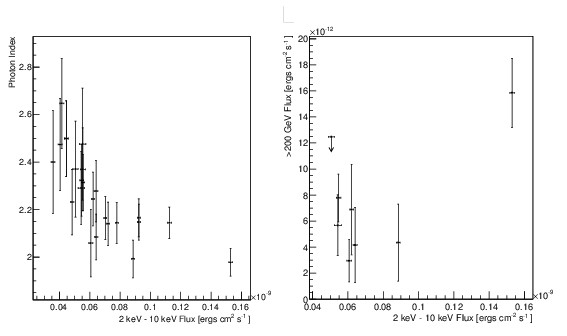
Figure 4: The left panel shows the 2-10 keV photon power law index versus the 2 keV-10 keV flux for the entire set of RXTE observations. The right panel shows the 2 keV -10 keV fluxes versus the > 200 GeV γ-ray fluxes measured with VERITAS for all simultaneous RXTE/VERITAS observations.
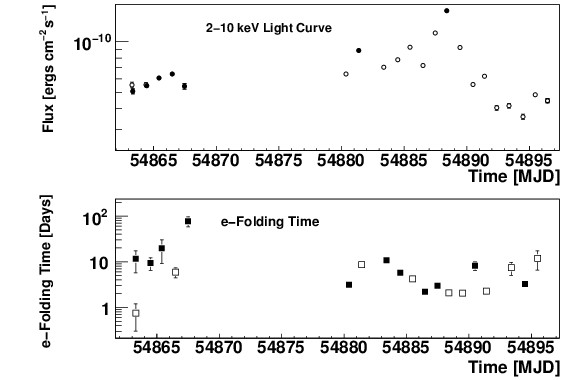
Figure 5: The top panel shows the 2 keV - 10 keV X-ray light curve for reference (same symbols as in Fig. 3). Solid markers highlight X-ray observations simultaneous with TeV observations. The bottom panel presents the e-folding times t0 determined from successive pairs of RXTE measurements (t0 = (t2 − t1)/(ln(f2) − ln(f1)) with t1, t2, and f1, f2 the times and fluxes of the two measurements, respectively). We only show data points with one-sigma errors smaller than the value of the data points. The solid (open) markers show positive (negative) e-folding times. We plotted the rise or decay time at the time of the first flux measurement. For days with more than one RXTE pointing, each successive pair of measurements gives one e-folding time t0.
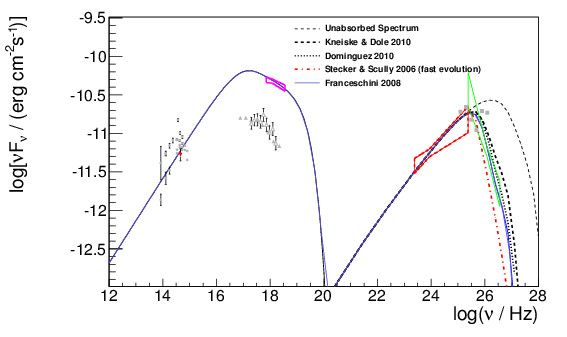
Figure 6: Broadband spectral energy distribution of 1ES 1218+30.4 with the optical (red inverted triangle), X-ray (RXTE, magenta bow-tie), high-energy γ-ray (Fermi LAT, red bow-tie) and VHE γ-ray (VERITAS, green bow-tie) data from the observation campaign
described in this paper. The grey data points show archival data from Sato et al. (2008) and references therein. The lines show the results of an SSC model without extragalactic absorption (blue line at low energies and dashed thin black line at high energies), and with the extragalactic absorption predicted by the EBL models of Kneiske & Dole (2010) (dashed thick black line), Domınguez et al. (2011) (dotted black line), Franceschini et al. (2008) (solid blue line), and Stecker et al. (2006) (dash-dotted red line). The SSC model parameters are given in Table 1.
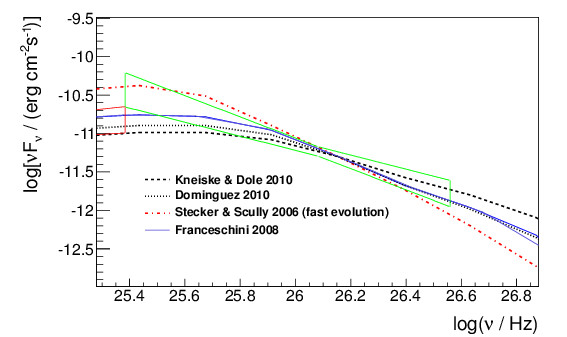
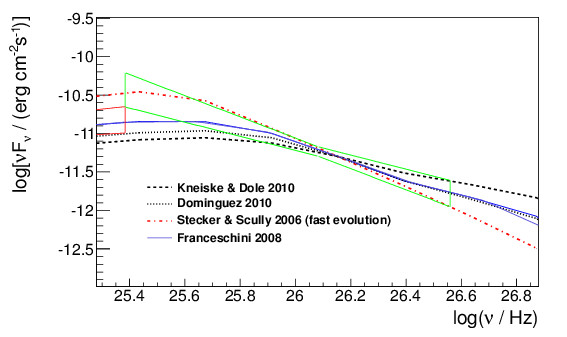
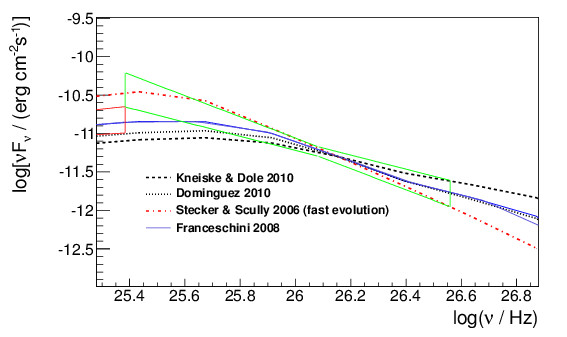
Figure 7: The panels show the agreement between various SSC+EBL models and the VERITAS VHE data. In each panel we adjusted the parameters to normalize all the models to the VERITAS 1 TeV flux (the normalization of the SSC model can be adjusted by choosing appropriate combinations of the normalization of the electron density in the emitting volume and the radius of the emission volume). The upper left panel uses the same model parameters as Fig. 6 (i.e. δj = 38, B = 0.0145 G) and shows a good agreement of the models and the data - except for the EBL model of Stecker et al. (2006) which seems to predict a too-soft γ-ray energy spectrum. The upper right panel and the lower panel show that the SSC model parameters can be adjusted to predict somewhat softer energy spectra (middle panel: δj = 76, B = 0.0145 G, lower panel: δj = 38, B = 0.0036 G).
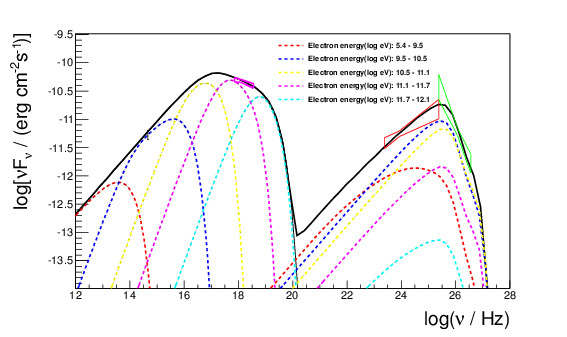
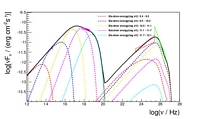
Figure 8: The data point and bow-ties show the energy spectra from the observation campaign described in this paper (the same as in Fig. 6). The thick black line shows the SSC model with the EBL model of Franceschini et al. (2008). In the case of the low-energy (synchrotron) component, the dashed lines show the synchrotron emission produced by different sections of the electron energy spectrum. In the case of the high-energy (SSC) component, the dashed lines show the inverse-Compton emission produced by the same sections of the electron energy spectrum up-scattering the synchrotron emission produced by all electrons. All inverse-Compton spectra are shown for the EBL absorption predicted by Franceschini et al. (2008). The results show that the inverse-Compton emission in the Fermi LAT and VERITAS bands is produced by electrons up-scattering synchrotron emission in the IR to soft X-ray bands.