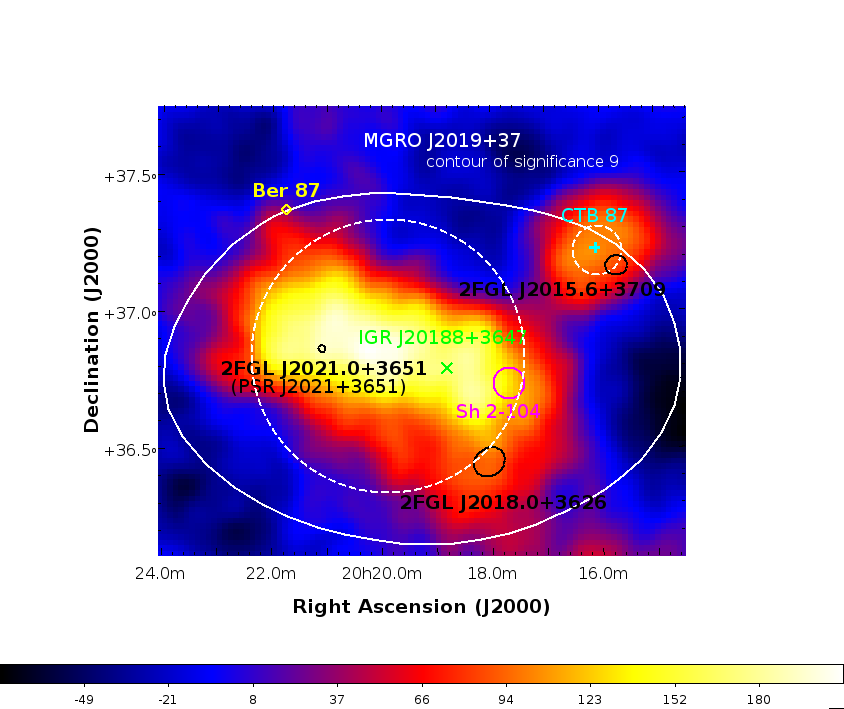
Between 2001 and 2007 the Milagro Collaboration carried out a survey of the Northern Galactic Plane, discovering diffuse TeV gamma-ray emission from the direction of Cygnus X (a,b). Cygnus X is the largest and more active region of creation and destruction of massive stars in the Milky Way. It is the home of potential cosmic-ray acceleration sites – SNRs, pulsars, massive stars, and binary systems. Therefore, this region is a natural laboratory for the study of cosmic rays and their origins, deemed by the National Academy as one of the 10 most important questions in modern astrophysics. Figure 1 (below, also shown in inset above) shows the VERITAS map of the region around MGRO J2019+37, the most intense gamma-ray emission in the Milagro map. The color bar indicates the number of excess events within a search radius of 0o.23. The shift between red and blue color scale occurs at the 3σ level. The contour of significance 9σ of MGRO J2019+37 is overlaid in white. The locations of possible counterparts are marked in the figure using different colors. VERITAS results reveal at least two separate TeV emission regions where a single source had been reported previously by Milagro. The faint point-like source VER J2016+371 overlaps CTB 87, a filled-center remnant (SNR) with no evidence of a supernova remnant shell at the present time. Its spectrum is well fit in the 0.65 − 10 TeV energy range by a power-law model with photon index 2.3 ± 0.4. VER J2019+378 is a bright extended (~1 deg) source, that likely accounts for the bulk of the Milagro emission. Its spectrum in the range 1 − 30 TeV is well fit with a power-law model of photon index 1.75 ± 0.3, among the hardest values measured in the VHE band (Figure 6, below), comparable to that observed near Vela-X. The physical origin of VER J2019+368 needs further investigation. Several scenarios have been proposed to contribute: a) nebular emission powered by the young pulsar PSR J2021+3651; b) massive star-forming region associated with the HII region Sharpless 104 (Sh 2-104) through wind collisions or interactions of protostar jets with the surrounding medium; c) emission related to the unidentified Fermi-LAT source 2FGL J2018+3626.
Figure 1: VHE gamma-ray excess map of the MGRO J2019+37 region as observed by VERITAS above 600 GeV. The color bar indicates the number of excess events within a search radius of 0o .23, which corresponds to the extended source search analysis described in the text. The shift between red and blue color scale occurs at the 3σ level. Regions used for spectral analysis of VER J2016+371 and J2019+368 are de fined by white dashed circles. The locations of possible counterparts are marked using diff erent colors. The contour of signi fcance 9σ of MGRO J2019+37 is overlaid in white.
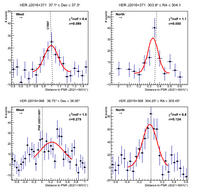
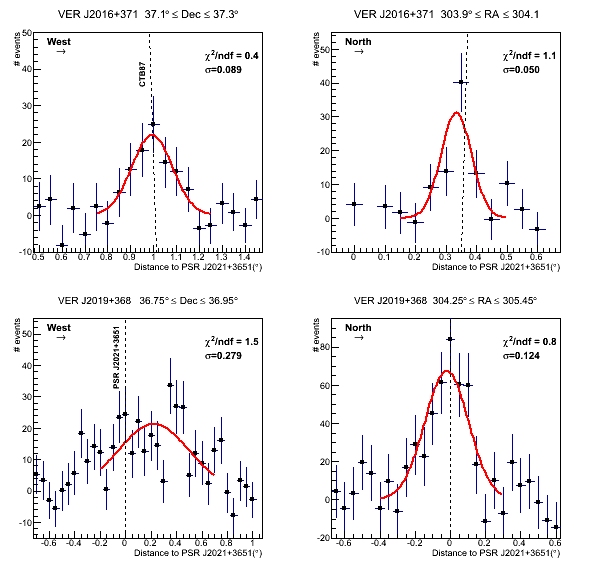
Figure 2: Slices in the uncorrelated excess maps of the new VHE sources. The width of the slice is indicated on each panel. The slices are centered on the best fi t position of each VHE source. The direction of the slices follows right ascension. The top panels show the slices for VER J2016+371 and the peak position of the 1420 MHz emission of CTB 87 (Kothes et al. 2003) is indicated with a dashed line. The bottom panels correspond to VER J2019+368 and the dashed line shows the position of the pulsar PSR J2021+3651.
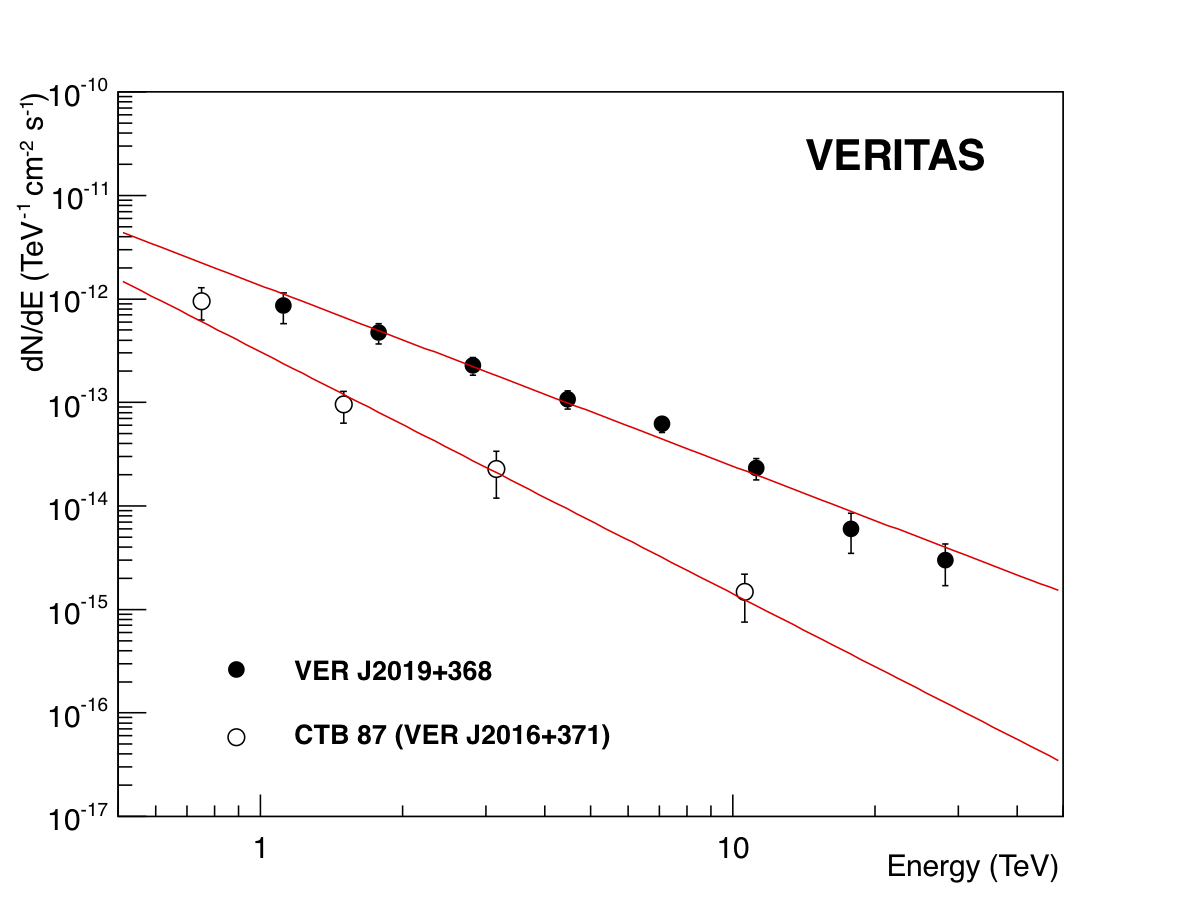
Figure 3: Di fferential energy spectrum of VER J2016+371/CTB 87 and VER J2019+368 as measured by VERITAS. The event excess in each bin have a statistical signi cance of at least 2 σ.
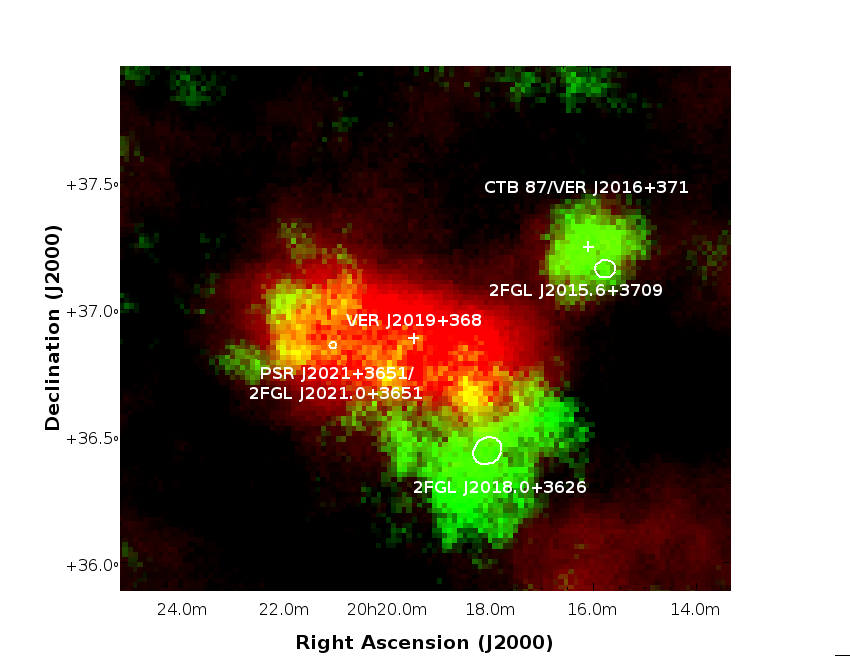
Figure 4: VHE gamma-ray excess maps of the MGRO J2019+37 region as observed with VERITAS in two di erent energy bands. The high energy band is above 1 TeV (red) while the low energy band is between 600 GeV and 1 TeV (green). The number of excess events in the maps has been obtained using a search radius of 0 o.23, which corresponds to the extended source search analysis described in the text. The change between the red and black in the color scale takes place at the 4σ level, while between green and black is at the 2 σ level.
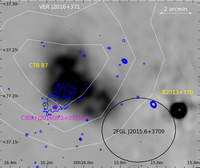
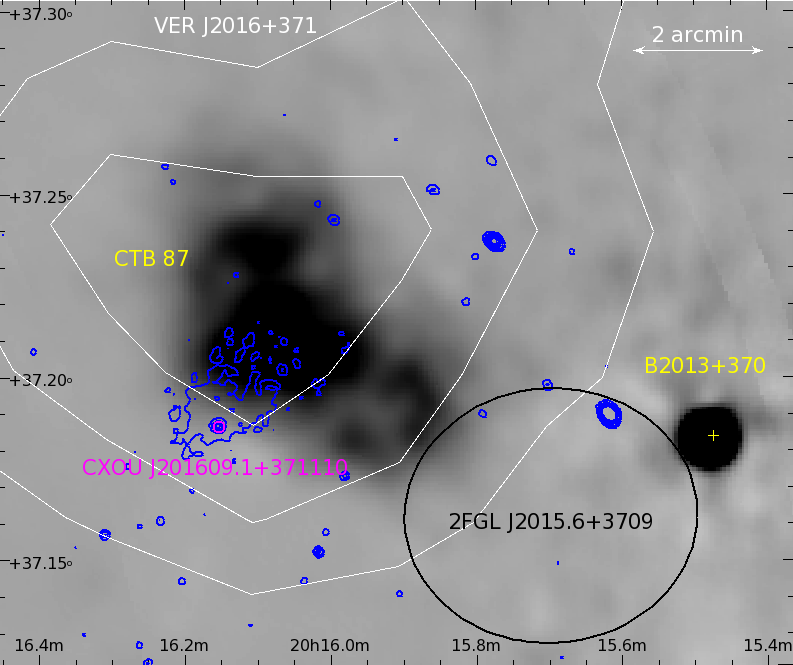
Figure 5: 610 MHz GMRT image of the CTB 87 region with X-ray and VHE gamma-ray contours in the equatorial coordinate system. The grey-scale image is smoothed with a 2D Gaussian ( σ = 30"). Blue contours indicate the X-ray morphology of the 0.3-7.5 keV Chandra image with the position of the putative pulsar indicated in magenta. The VERITAS emission with integration radius of 0 o.089 is shown as overlaid white contours of signifi cance 3, 4 and 5σ . The blazar B2013+370 and the 95% error ellipse of 2FGL J2015.6+3709, which are likely to be mutually associated, are also indicated.
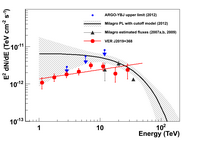
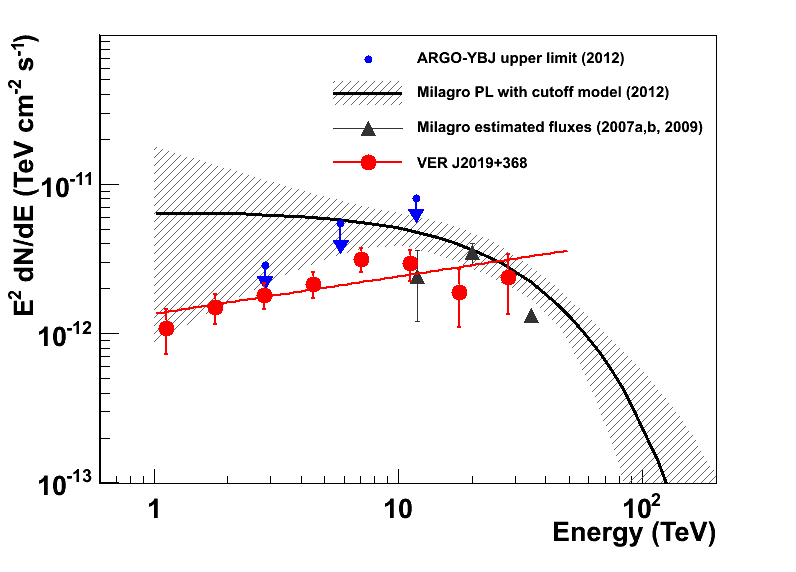
Figure 6: Spectral energy distribution of MGRO J2019+37/VER J2019+368 as measured by di fferent instruments. VERITAS measures a spectrum from 1 TeV to almost 30 TeV, shown in red, which is best fi t with a power law with a hard spectral index. The Milagro flux points at 12, 20 and 35 TeV are shown in black (Abdo et al. 2007a,b, 2009a) and also in black is their best fi t, a power law with a cutoff (Abdo et al. 2012). The shadowed area corresponds to the 1 σ band. ARGO-YBJ 90% con fidence level upper limits for MGRO J2019+37 are shown with blue arrows (Bartoli et al. 2012).
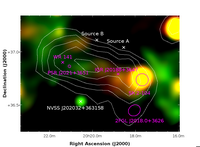
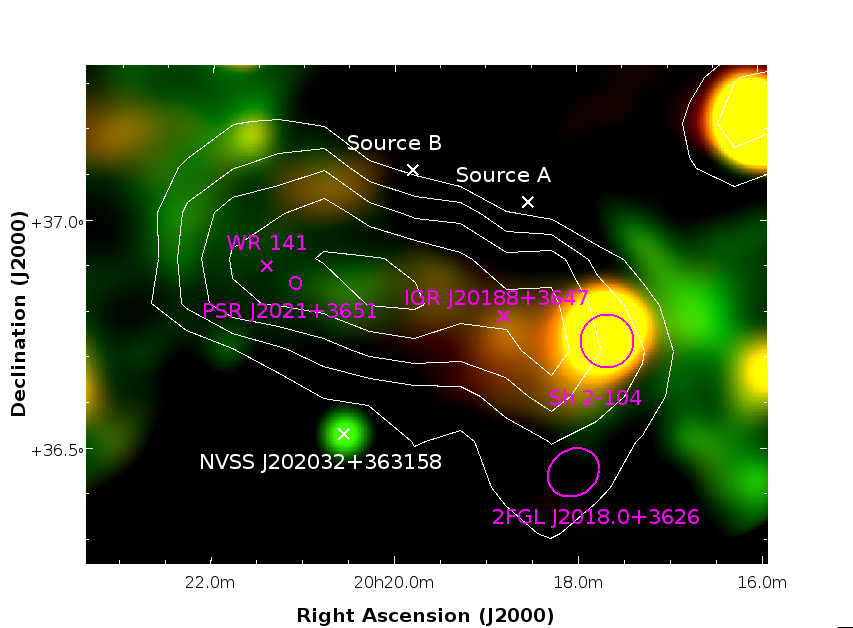
Figure 7: False color image of the radio diff use emission of the VER J2019+368 region obtained with CGPS 408 MHz (green) and GB6 6cm (red). To produce this image we have taken the CGPS and GB6 radio images of the region and convolved them with the same beam size. The VERITAS signi ficance contours at 3, 4, 5, 6 and 7σ obtained with the large integration radius (0o .23) are overlaid. Possible counterparts to MGRO J2019+37 within the literature are marked and labelled in magenta if they fall inside the 3σ contours of VER J2019+368 and white otherwise.

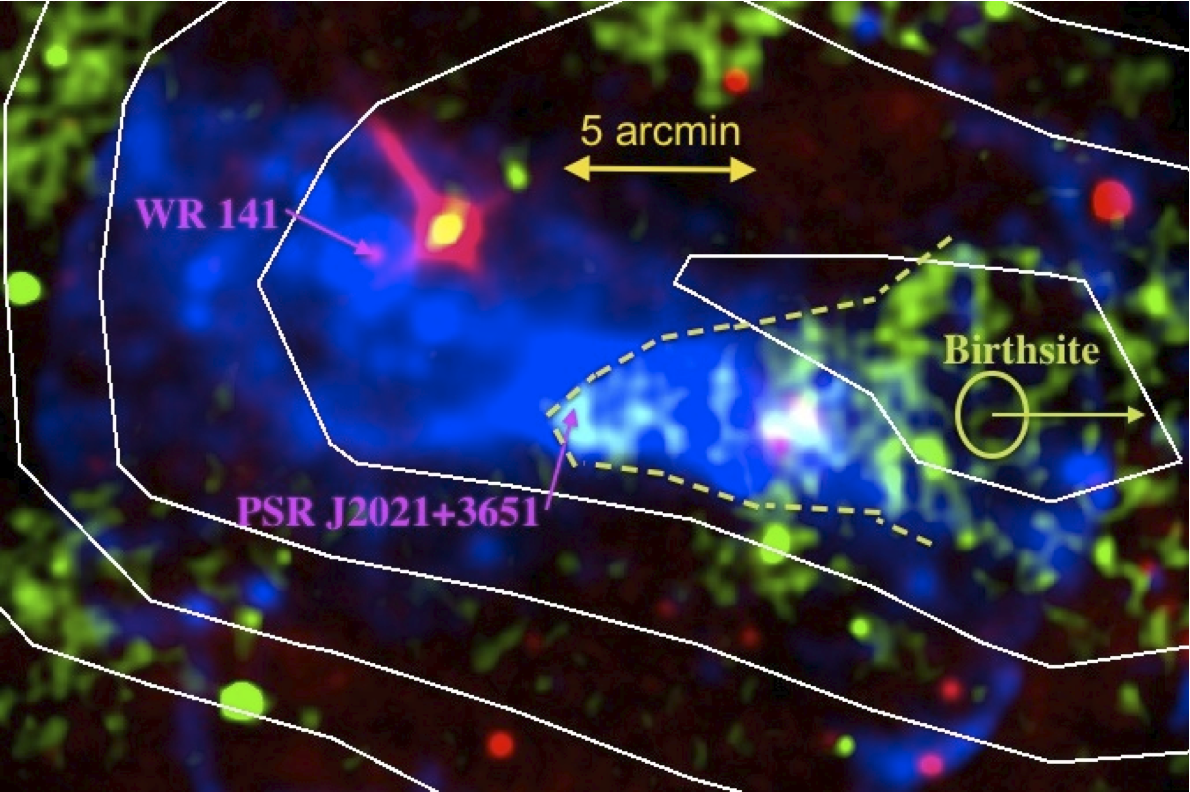
Figure 8: False color image of the infrared, radio and X-ray emission in the vicinity of PSR J2021+3651 obtained with MSX 8.3 m (red), VLA 20cm (green) and XMM 1-8 keV (blue), respectively. The VERITAS signifi cance contours at 3, 4, 5, 6 and 7 σ obtained with the large integration radius (0 o.23) are also shown. Overlaid dashed line highlights the PWN morphology in radio, and an ellipse marks the closest birthsite suggested by this morphology. An arrow indicates the direction of the birthsite if it happened further away.