Blazars are active galactic nuclei (AGN) with a relativistic jet pointing towards the observer. They are extremely luminous, energetic, and variable. AGN are powered by supermassive black holes at their centers. Particles are accelerated to relativistic energies in the jets and are mainly responsible for the radiation that is detected from the blazars. BL Lacertae is a blazar located at a redshift of z~0.07.
VERITAS observed BL Lacertae for 20.3 hrs from 2010 September to 2011 November. On 2011 June 28, BL Lacertae was detected by VERITAS during the decay phase of a rapid and intense flare (see Figure 1).
For the first time, a rapid (minute-scale) TeV gamma-ray flare is seen from BL Lacertae -- this is the first such flare from an LBL. Independent of any models, the measured decay time of the flare, ~13 minutes, requires that the size of the emitting region be very small (<2.2*10^13*delta cm, delta being the Doppler factor). Moreover, the fact that the emitted gamma rays escape pair production with lower energy photons in the emitting
regions requires the Doppler factor of the TeV emitting region to be large (with lower limit range between 13 to 17).
Such fast TeV flares have been previously observed from several other blazars. However, for the particular case of BL Lacertae, interesting contemporaneous multi-wavelength behavior has also been observed, and is possibly associated with the TeV flare. Notably, the polarization variation and the emergence of a superluminal radio knot (K11) help to explain how the TeV flare happened. MWL light curves and a series of 43 GHz VLBA images of BL Lacertae around the time of the gamma-ray flare are shown. There was no apparent radio flux variation at the time of the TeV flare, but a radio flare was observed in multiple radio frequencies about 4 months later. Theoretical models are needed to explain the multi-wavelength observations.
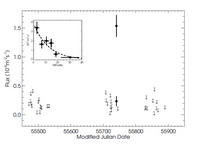
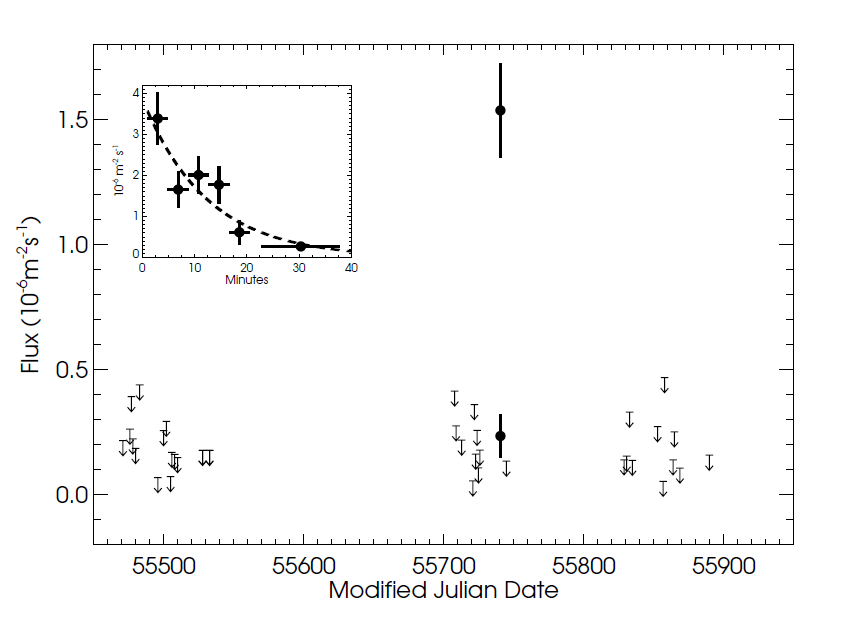
Figure 1: TeV gamma-ray light curve of BL Lacertae (> 200 GeV). When the source was not significantly detected, 99% confidence upper limits are shown. The upper limits were derived by combining data from all observation runs for each night, but for the night of the flare, the fluxes derived from the two individual runs are shown separately. The inset shows the flare in detail, in 4-minute bins for the first run, and one 16-minute bin for the second run, with minute 0 indicating the start of the first run. The dashed line shows the best fit to the profile with an exponential function (see text).
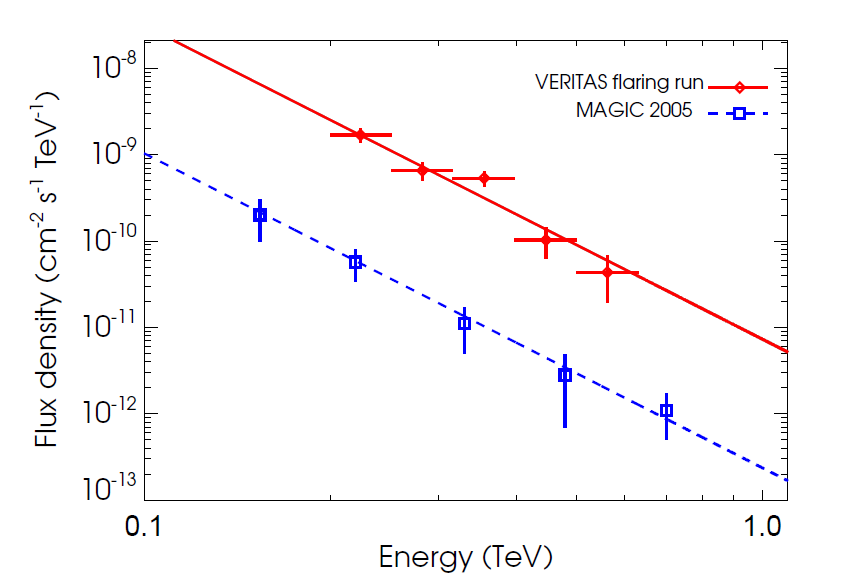
Figure 2:TeV gamma-ray spectrum of BL Lacertae. The VERITAS data points are shown as red open diamonds, along with the best-fit power law (solid line). For comparison, we also show the published MAGIC spectrum of the source as blue open squares, along with the best-fit power law (dashed line). The two power laws have comparable slopes.
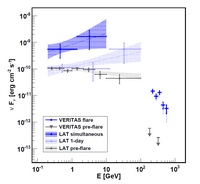
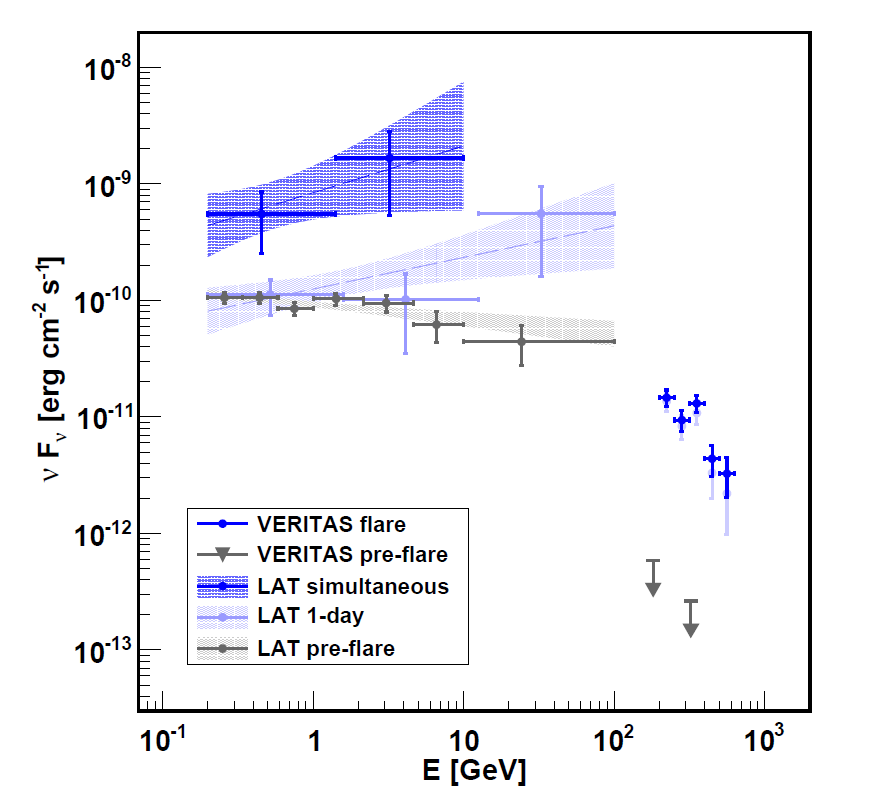
Figure 3: Broadband gamma-ray spectrum of BL Lacertae. For VERITAS, the flare spectrum with EBL correction is shown as blue points with uncertainties, and the spectrum without EBL correction is shown as lighter blue points. Also plotted are the 95% confidence upper limits that were derived from 14 VERITAS observation runs in the month prior to the flare. For the Fermi-LAT data, the simultaneous, 1-day, and pre-flare spectra are shown in blue, light blue, and gray. The pre-flare spectrum was derived from LAT observations taken over a period of one month before the TeV gamma-ray flare. The shaded areas show the 1 σ confidence interval of the overall Fermi derived spectra, independent from the data points..
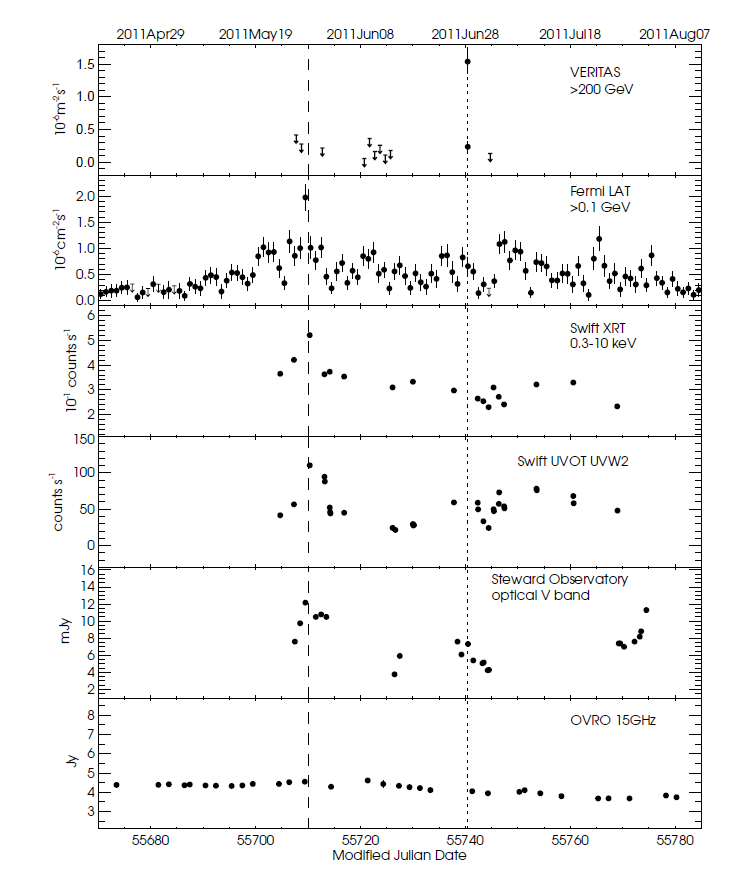
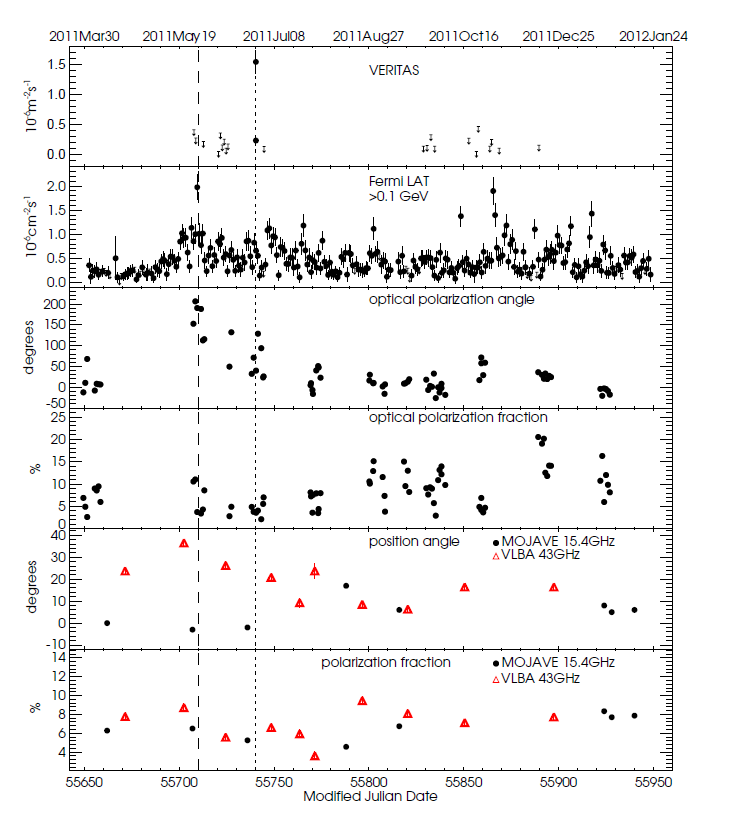
Figure 4: Multiwavelength light curves of BL Lacertae. Fermi-LAT 1 upper limits are shown as arrows. The dotted line indicates the time of the TeV gamma-ray flare seen with VERITAS, while the dashed line shows the time of a rapid GeV gamma-ray flare seen with the Fermi-LAT.
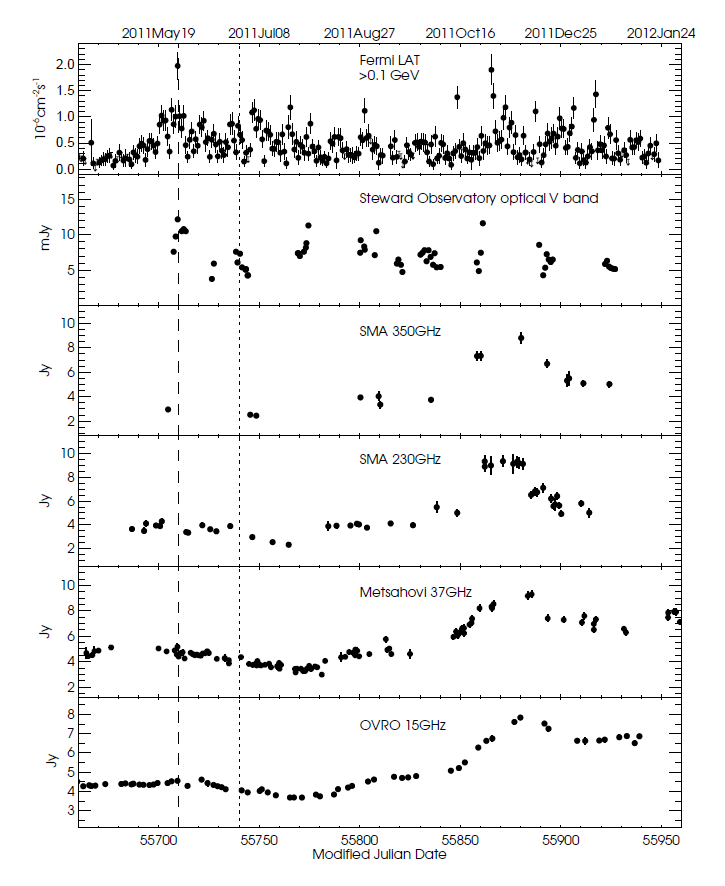
Figure 5: Extended Fermi-LAT, optical, and radio light curves of BL Lacertae. As in Fig. 4, the dotted line indicates the time of the VERITAS flare, and the dashed line shows the time of the Fermi-LAT flare.
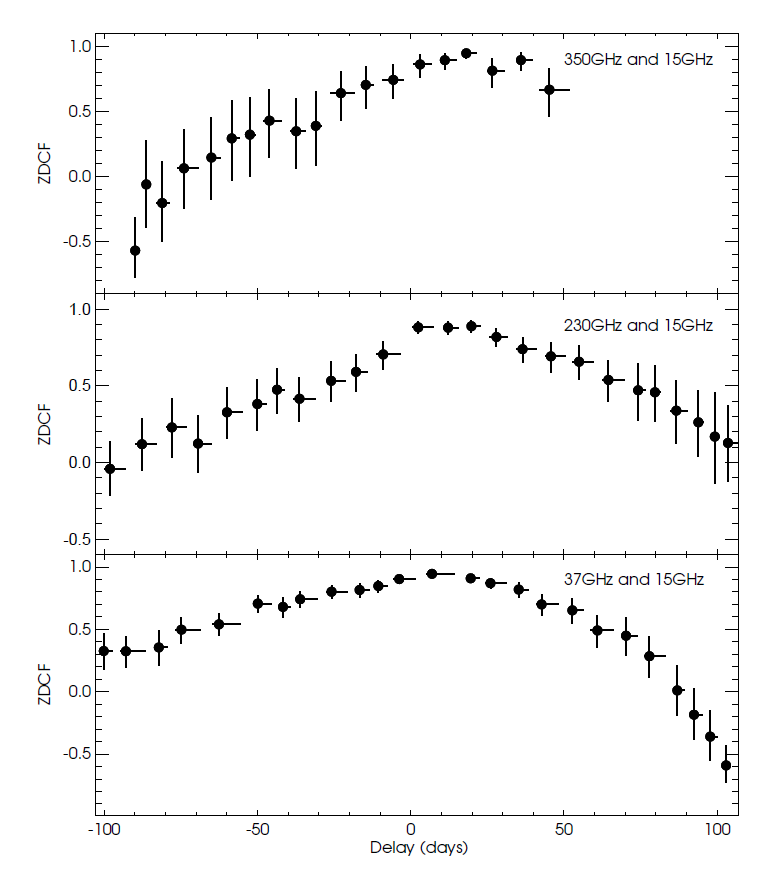
Figure 6: Cross-correlation functions derived from the light curves of BL Lacertae: top between the SMA 350 GHz and OVRO 15 GHz bands; middle between the SMA 230 GHz and OVRO 15 GHz bands; and bottom between the Metsahovi 37 GHz and OVRO 15GHz bands. Positive delays indicate “lead” with respect to the reference (OVRO 15 GHz) band.
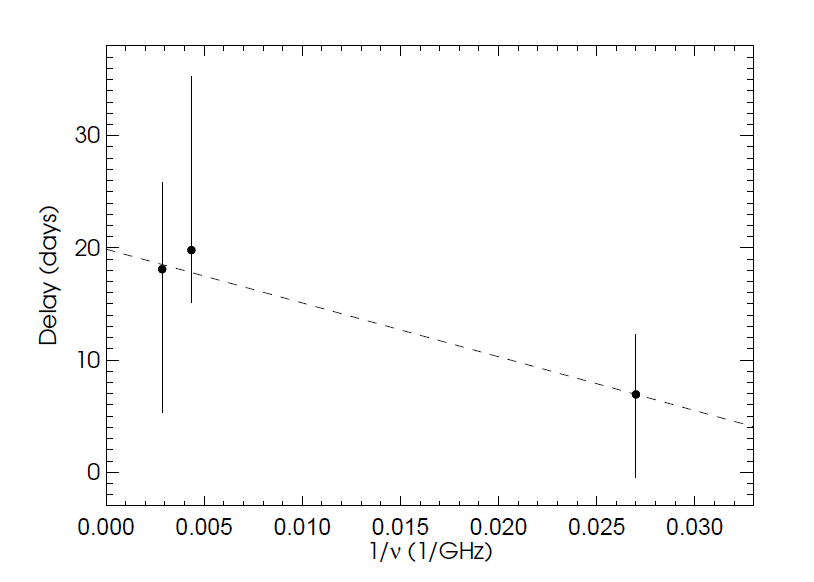
Figure 7: Time delays of the radio flare from BL Lacertae. The time delays with respect to the OVRO band were determined from a likelihood code PLIKE. Positive delays indicate “lead” with respect to the OVRO band. The dashed line is drawn to guide the eye. See the text for discussion.
Figure 8: Polarized optical and radio emission from BL Lacertae. VERITAS and Fermi- LAT light curves are also shown for comparison. The optical measurements were made at the Steward Observatory, while the radio measurements were made with the VLBA at 15.4 GHz (black dots) and 43 GHz (red triangles). The radio electric vector position angle has an uncertainty of about ±3 degrees, and the polarization fraction has an uncertainty of about 5%. The dotted line indicates the time of the VERITAS flare, and the dashed line shows the time of the Fermi-LAT flare.
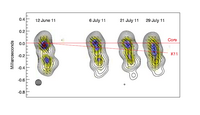
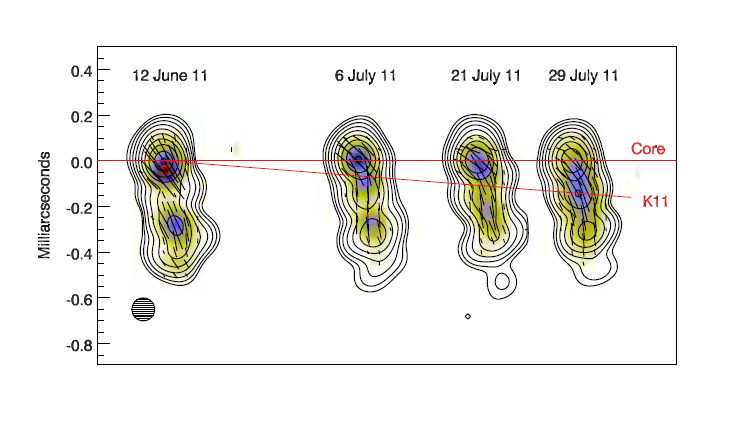
Figure 9: 43 GHz VLBA images of BL Lacertae at four epochs around the time of the TeV gamma-ray flare. The images are convolved with a circular Gaussian function (represented by the circle in the bottom-left corner) that has a full width at half maximum of 0.1 mas (i.e., 0.15 pc at the distance of 311 Mpc), the approximate resolution of the longest baselines of the array. Contours correspond to total intensity, with levels in factors of 2 from 0.25%, plus an extra contour at 96%, of the peak intensity of 2.16 Jy beam−1. Color represents linearly polarized intensity, with maximum (black) of 0.103 Jy beam−1 followed by red, blue, yellow, and white (no polarization detected). Red lines mark the position of the assumed stationary core and the superluminally moving knot K11, each of which has a distinct polarization position angle.
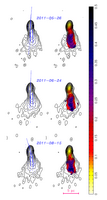
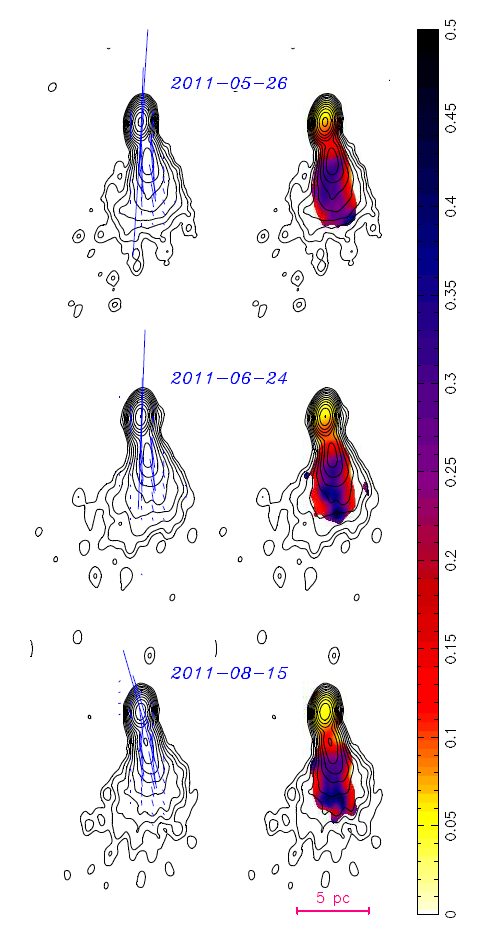
Figure 10: MOJAVE 15.4 GHz VLBA images of BL Lacertae at three epochs in 2011, showing a change in core polarization after the 2011 June 28 TeV flare. The images on the left show total intensity contours, with electric polarization vectors overlaid in blue. The images on the right show total intensity contours with fractional linear polarization in color. The polarization color scale ranges from 0 to 50%. The images have been convolved with the same Gaussian restoring beam having dimensions 0.89 mas × 0.56 mas and position angle−8 degrees. The base contour levels in each image are 1.3 mJy beam−1 in total intensity and 1 mJy beam−1 in polarization. The angular scale of the image is 1.29 pc mas−1.