Reference: E. Aliu et al. (The VERITAS Collaboration), Astrophysical Journal 754: 77, 2012
Full text version
ArXiv: ArXiV:1205.5287
Contacts: Daniel Gall, Kazuma Tsurusaki
In March 2010, the Fermi-LAT Collaboration announced a new GeV transient in the galactic plane, FGL J2102+4542, that was identifed as a nova outburst in the symbiotic binary V407 Cygni. A nova is the result of a runaway thermonuclear event initiated when material accreted onto a white dwarf from a companion star reaches the temperature and pressure required for nuclear burning and can result in a sudden increase in optical brightness of several magnitudes. A nova outburst from V407 Cyg was detected in the optical waveband on 2010 March 10 with a magnitude of 6.9, while pre-outburst magnitudes from the previous two years of monitoring ranged between magnitude 9 and 12. The V407 Cygni system consists of a Mira-type pulsating red giant and a white dwarf.
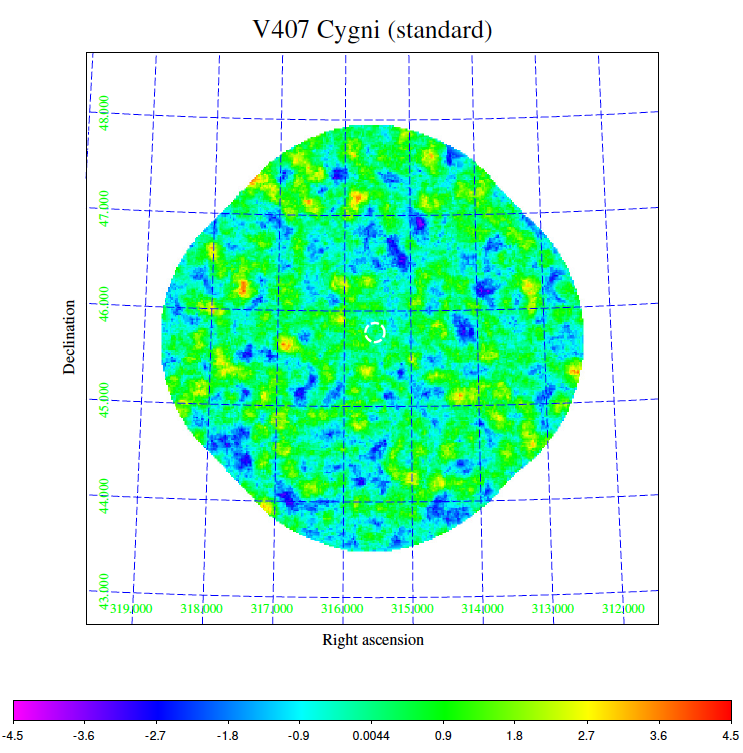
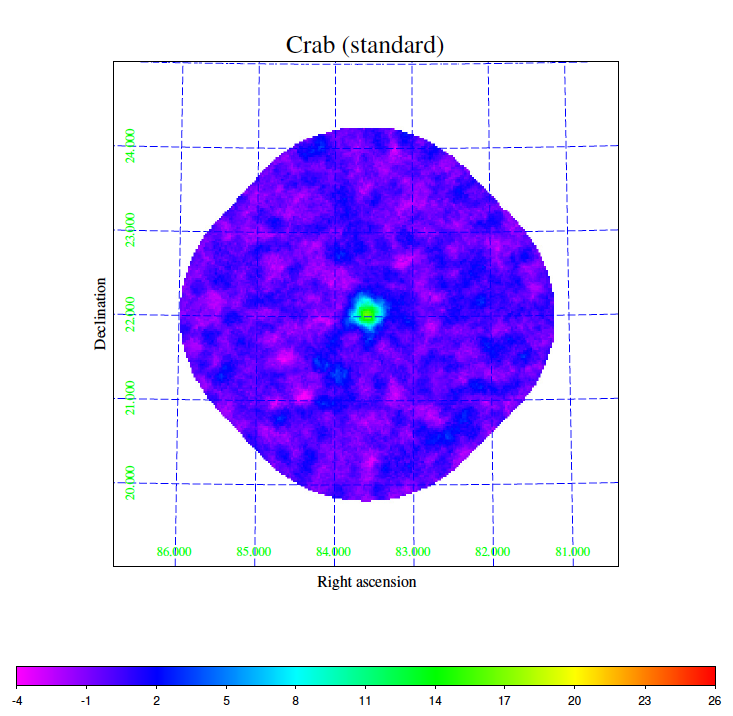
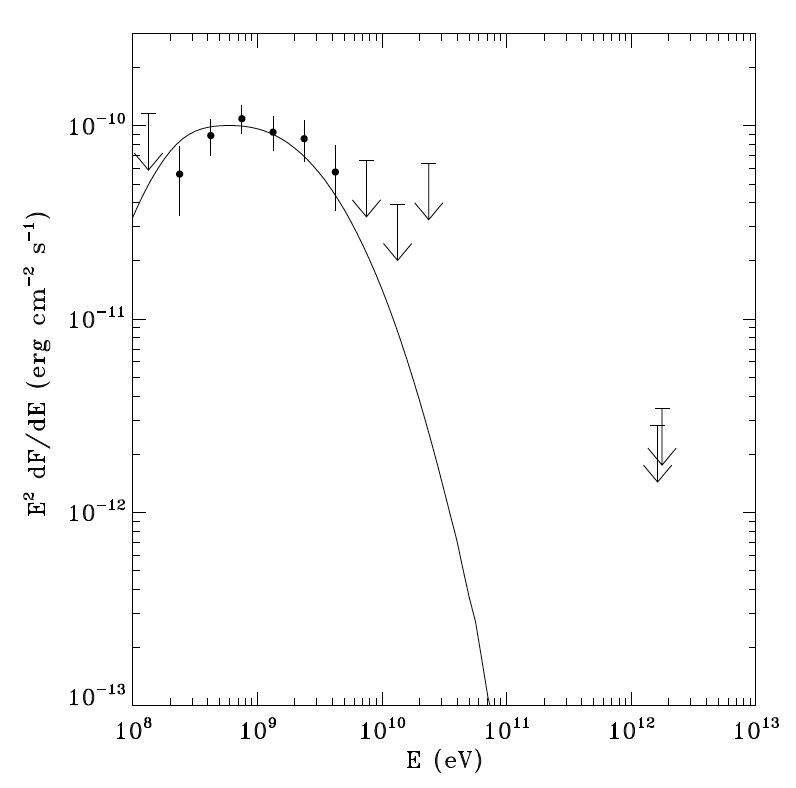
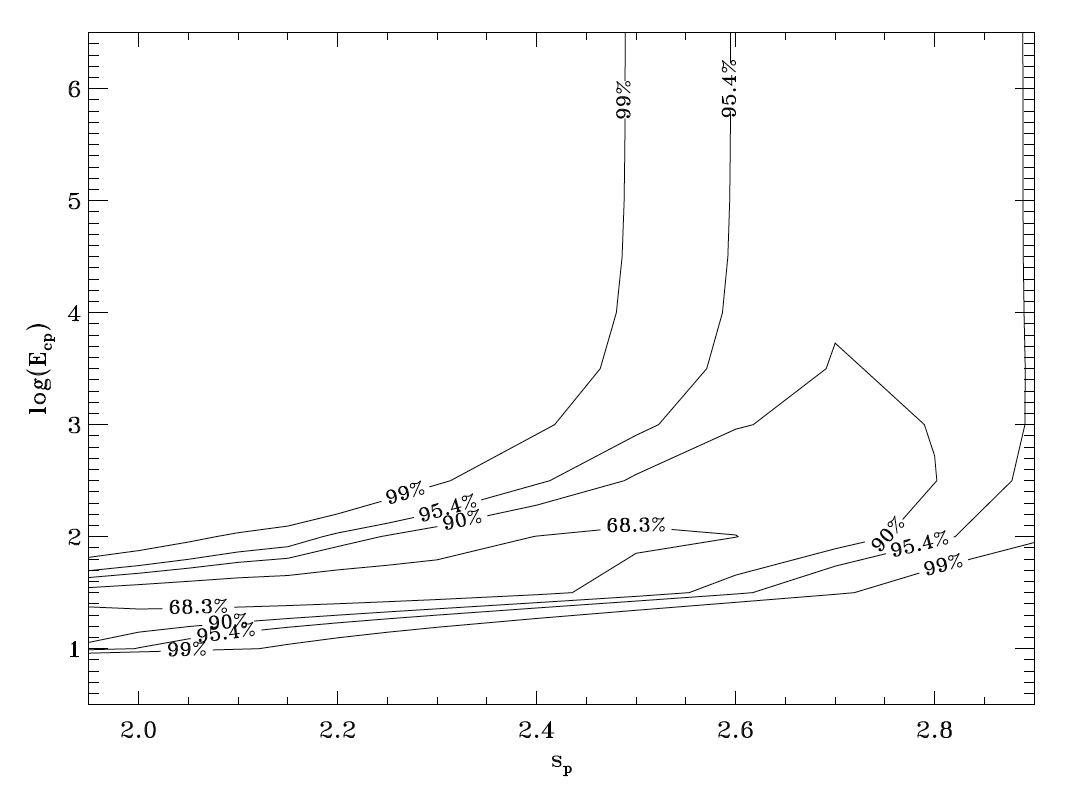
VERITAS observed V407 Cygni for several nights after the announcement of the Fermi-LAT detection, during days 9 - 16 of the outburst (2010 March 19 - 26). The zenith angle of these observations ranged between 50 and 66 degrees (VERITAS typically observes at zenith angle smaller than 40 degrees). Analysis of the VERITAS data did not show a significant detection at the location of V407 Cygni. This paper presents the VHE upper limits calculated based on the VERITAS observations, an overview of a new reconstruction method that is optimized for large zenith angle observations, and the implications of the VHE upper limits for the models of the outburst.
Figures from paper (click to get full size image):