
Reference: E. Aliu et al. (The VERITAS Collaboration), Astrophysical Journal 742: 127, 2011
ArXiv: ArXiV:1110.5949
Contacts: Amy Furniss
The recent detection of very-high-energy (VHE, E> 100 GeV) photons from a previously unidentified source - RX J0648.7+1516 has allowed the association of the target with an X-ray source found in a survey more than a decade ago. Immediately following the discovery of this VHE emission, observatories across nearly all wavelengths temporarily turned their attention to this source.
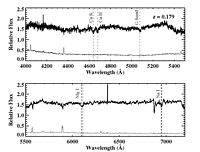
The multiwavelength data that was collected included optical spectroscopy with the Lick Observatory in California, allowing a first-time-ever optical identification of this unidentified X-ray source as a BL Lac type active galactic nucleus. This particular type of galaxy is theorized to have a powerful jet emerging from a supermassive black hole at the center of the galaxy that is pointed directly along the Earth line of sight. These galaxies are the most common type of galaxy to be detected by very high energy observatories such as VERITAS. The optical spectroscopy provided by the Lick Observatory also allowed the determination of the relative distance to the blazar, a very important piece of information in understanding the nature of these extreme galaxies.
Other multiwavelength data collected included observations from two space-based NASA observatories: the Swift space-based telescope with both X-ray and the UV instruments onboard, and the Fermi Large Area Telescope, a high-energy gamma-ray mission. The organized collection of these data is a good illustration of the astronomical community's efforts to work together in exploring the mysteries of the Universe, allowing a more foundational view of interesting targets like the galaxy RX J0648.7+1516. With this complete multiwavelength view of the galaxy, VERITAS has the ability to derive information about how the galaxy RX J0648.7+1516 is producing the very high energy photons that were discovered.
Figures from paper (click to get full size image):
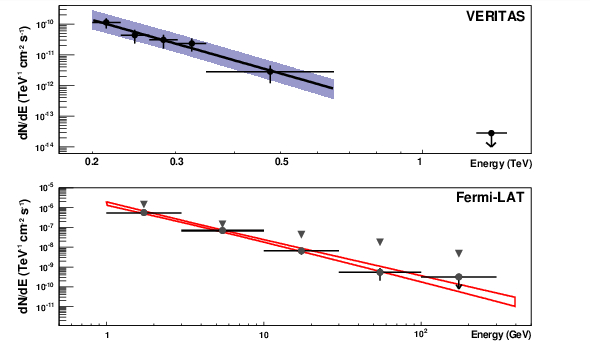

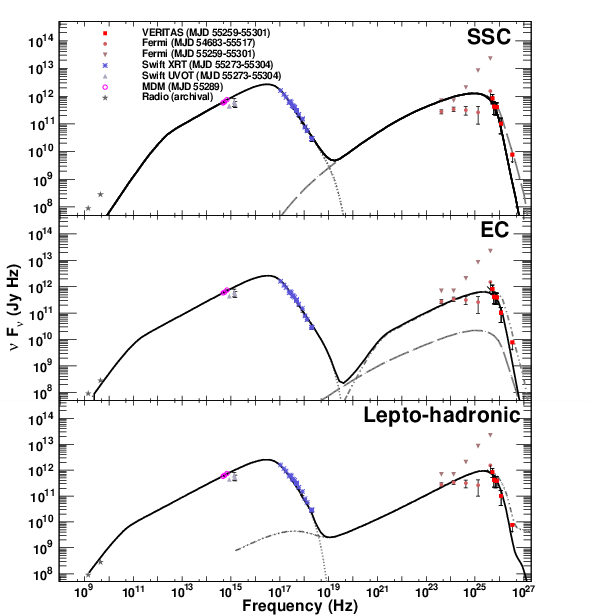
Figure 3: The SED models applied to the contemporaneous multiwavelength data of RXJ0648.7+1516. Fermi -LAT data points are shown for 2.3 years of data along with upper limits extracted from data limited to the VERITAS observation period. The models shown here are constrained by the MDM points; modeling constrained by the UVOT data produces similar results. The top panel shows the synchrotron emission (dotted line), the self-Compton emission (dashed) and the EBL-corrected (Gilmore et al. 2009) total onezone SSC model (solid). The middle panel shows the synchrotron emission (dotted line), the self-Compton emission (dashed line), the external-Compton (dash-dotted line) and the EBL-corrected total EC model (solid). The bottom panel shows the electron (and positron) synchrotron emission (dotted line), the proton synchrotron emission (dash-dotted) and the EBL-corrected total lepto-hadronic model (solid).