2008 Mrk 421 light curves. For more details see Figure 2 below. The vertical lines enclose phases of enhanced X-ray and enhanced TeV activity.
Reference: V. A. Acciari et al. (The VERITAS Collaboration), Astrophysical Journal 738: 25, 2011
The blazar Mrk 421 is one of the strongest (and best studied) extragalactic TeV gamma-ray source in the sky. It is located at a redshift of 0.031 and was first discovered at TeV energies by the Whipple 10m telescope in 1992 (Punch et al 1992). Mrk 421 was extensively observed with the VERITAS observatory and the Whipple 10m telescope in 2006-2008. The excellent sensitivity of VERITAS allowed us to sample the TeV gamma-ray fluxes and energy spectra with unprecedented accuracy. On May 2nd and 3rd, 2008, bright TeV gamma-ray flares were detected with fluxes reaching the level of 10 Crab. A spectral hardening with increasing TeV flux level is observed.
The TeV gamma-ray data were complemented with radio, optical, and X-ray observations, resulting in one of the best covered multi-wavelength light curve of a TeV blazar measured so far. Flux variability is found in all bands except for the radio waveband. The X-ray data reveal spectral hardening with increasing flux levels, often correlated with an increase of the source activity in TeV gamma-rays. Contemporaneous spectral energy distributions were generated for 18 nights, each of which are reasonably well described by a one-zone SSC model.
Figures from paper (click to get full size image):
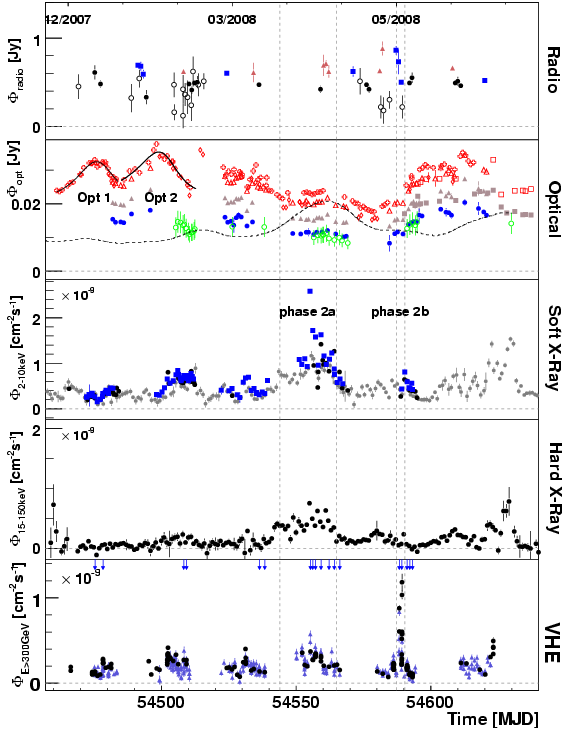
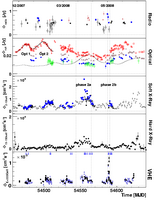 Figure 2: 2008 Mrk 421 light curves. For details see caption and legends in Figure 1. The vertical lines enclose phases of enhanced X-ray (phase 2a) and enhanced TeV (phase 2b) activity; see Figure 3 for a zoomed view of these phases. An exponential rise/fall function was fitted to the optical R band Tuorla/KVA data (’Opt 1’ & ’Opt 2’, see discussion in Sec. 3.4 and fit results in Tab. 3). The dashed line represents the optical rise/fall function folded with the ASM X-ray (dwell-by-dwell) light curve (see text for disussion). The vertical arrows pointing downwards in the bottom panel indicate the dates for which we compiled quasi-simultaneous SEDs and modeled them with a SSC code (see Figures 11 & 12).
 Figure 3: Mrk 421 light curves measured during the X-ray/TeV flaring state in April/May 2008 (phase 2). For details see caption and legends in Figure 1. The vertical dotted line highlights the brightest X-ray flare observed with the RXTE/PCA. The vertical arrows pointing downwards in the bottom panel indicate the dates for which we compiled quasi-simultaneous SEDs and modeled them with a SSC code (Figures 11 & 12).
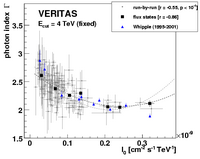
Figure 6: Photon index Γ versus flux normalization I0 (at 1TeV) obtained from a power-law fit with exponential cutoff (fixed to Ecut = 4TeV, statistical errors only). Each gray data point corresponds to a data run with a duration of 10 to 20min. The black points correspond to the values obtained from the fits to the spectra grouped according to their flux states (defined in Figure 5 and Table 2). Correlation coefficients r and the corresponding chance probabilities for the null hypothesis (no correlation) are given in the legend. Results obtained from earlier Whipple 10m observations (Krennrich et al. 2002) are shown for reference.
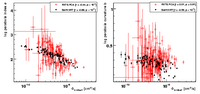
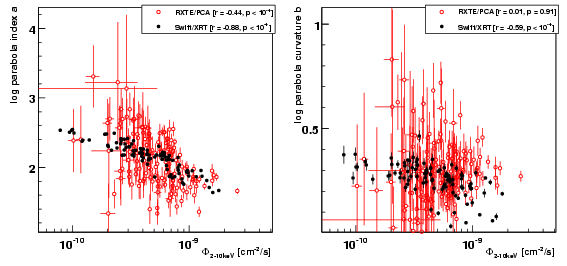
Figure 7: Correlations between the spectral shape and the flux level for the X-ray data sets taken with RXTE/PCA and Swift/XRT. Correlation coefficients r and the corresponding chance probability for the null hypothesis (no correlation) are given in the legends. Left: The log-parabola parameter a vs. the 2 − 10 keV photon flux. Right: The log-parabola curvature parameter b vs. the 2 − 10 keV photon flux.
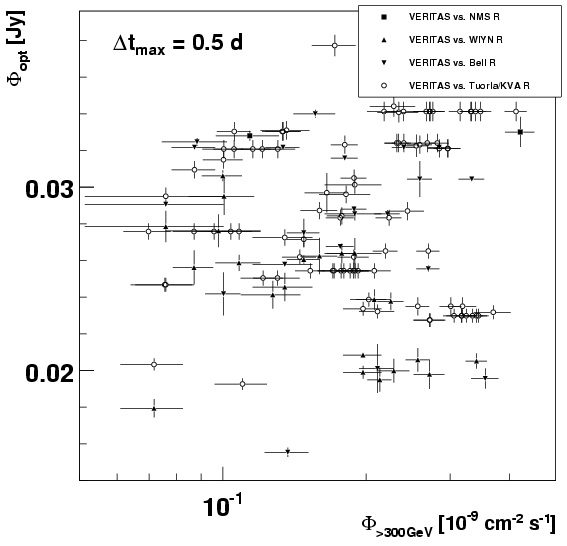
Figure 8: Correlation between TeV and optical fluxes. The maximum allowed time difference between the data points is Δt ≤ 0.5 days.
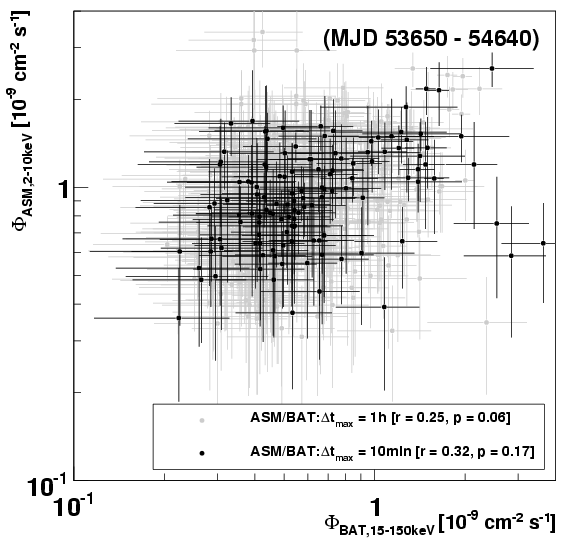
Figure 9: Hard/soft X-ray flux correlation between the 15 − 150 keV Swift/BAT flux and the 2 − 10 keV RXTE/ASM flux. All dwell-by-dwell flux points with a statistical significance above 2σ measured in the first half of 2008 (MJD 54457– 54640) are shown for two cases of a maximum time lag between the observed data points. The legend gives the corresponding correlation coefficient and the corresponding chance probability for the noncorrelation.
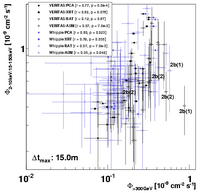
Figure 10: Correlation between TeV fluxes (VERITAS and Whipple) and X-ray fluxes (RXTE: PCA & ASM, Swift: XRT & BAT). All X-ray fluxes are given between 2 − 10 keV, except for the Swift/BAT fluxes which are given between 15 − 150 keV. Only data measured in the first half of 2008 (MJD 54457–54640) are shown. The RXTE/ASM and Swift/BAT fluxes are dwell by dwell with the requirement that the statistical significance is above 2 standard deviations. The maximum time difference between the data points is Δt ≤ 15min. The correlation coefficients including the chance probability for the null hypothesis are shown in the legend. The flux pairs measured during the first (2b(1)) and second night (2b(2)) of phase 2b are marked.
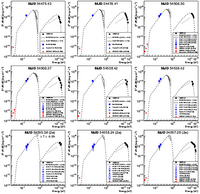
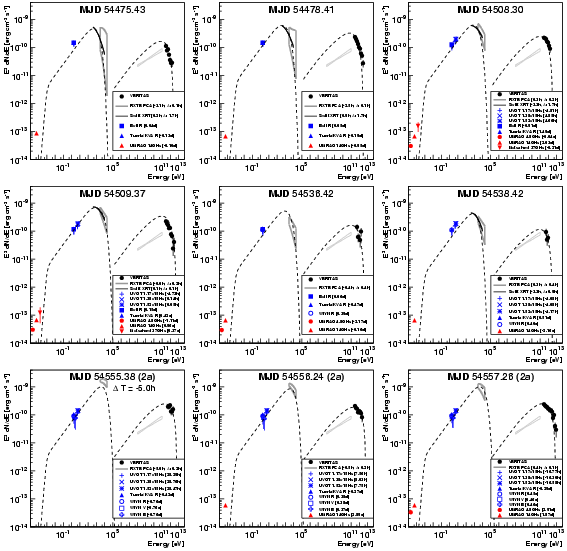
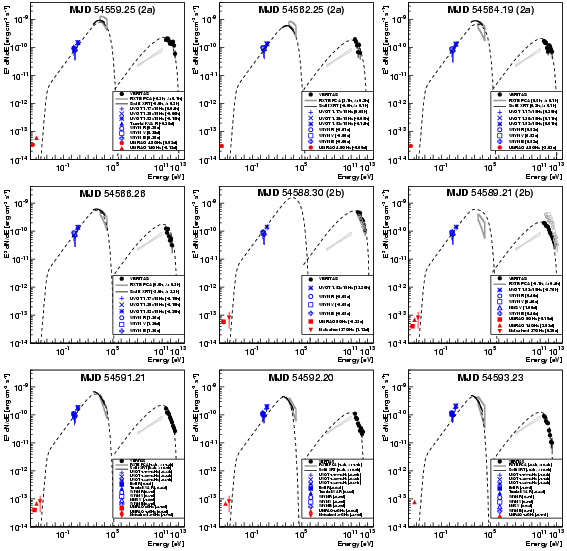
Figure 11: SEDs of Mrk 421 for individual dates showing all available MWL data (statistical errors only) if the corresponding time lag criterion is met (see text for more detail). The legends indicate the time lags ΔT = TMWL−TTeV between the individual MWL data and the VERITAS data. For the X-ray observations, the duration of the pointing Δ is given, as well. The number in parentheses refers to the phase (2a or 2b) during which the The SEDs were fit by a one-zone SSC model (dashed curves); the corresponding model parameters are summarized in Table 4. The non-simultaneous MeV/GeV spectrum measured by Fermi (August 2008 to July 2009) is shown for reference (Abdo et al. 2010).
Figure 12: SEDs of Mrk 421, continued from figure 11. The SEDs of the two flare nights are also shown: MJD 54588.30 (no X-ray coverage in this night) and MJD 54589.21 with X-ray coverage during the onset of the flare (solid TeV points) but not during the high flare state (open TeV data points).

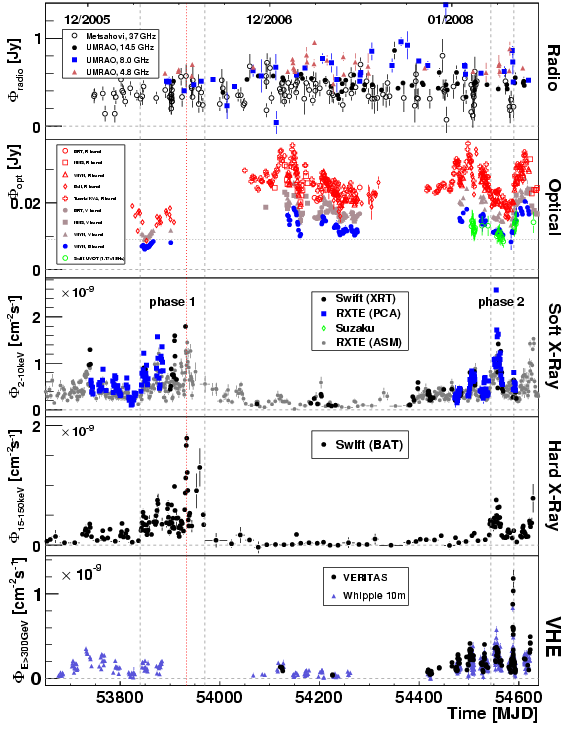 Figure 1: Mrk 421 light curves measured by different experiments (see Section 2) in 2006-2008. All errors are statistical errors only. Shown are the radio band (upper panel), the optical band (second panel), the X-ray band (third & fourth panel) and the TeV band (bottom). Some of the RXTE/ASM and Swift/BAT flux points have been re-binned for better visibility. Two phases of activity can be identified in the X-ray and TeV bands (phases 1 and 2). The vertical dotted line indicates the maximum of the hard X-ray flux (Swift/BAT, phase 1). During phase 2 a very good X-ray/TeV coverage was achieved, where the X-ray observations were partly triggered by VERITAS.
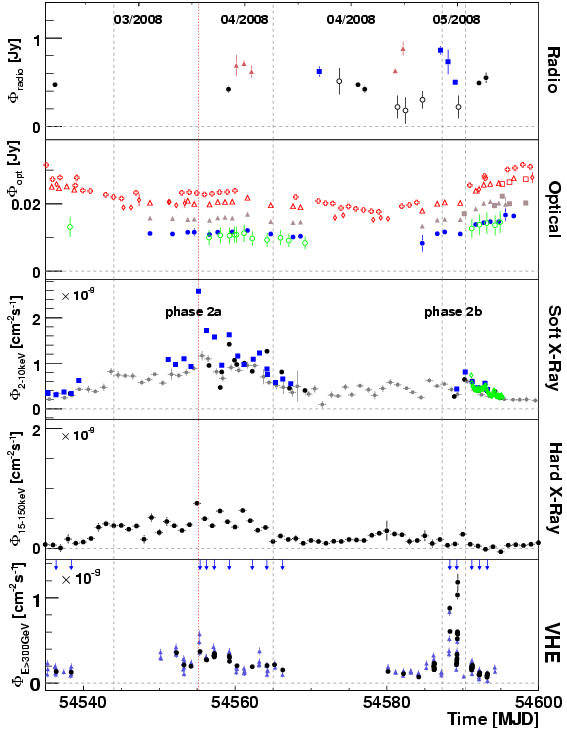 Figure 3: Mrk 421 light curves measured during the X-ray/TeV flaring state in April/May 2008 (phase 2). For details see caption and legends in Figure 1. The vertical dotted line highlights the brightest X-ray flare observed with the RXTE/PCA. The vertical arrows pointing downwards in the bottom panel indicate the dates for which we compiled quasi-simultaneous SEDs and modeled them with a SSC code (Figures 11 & 12).
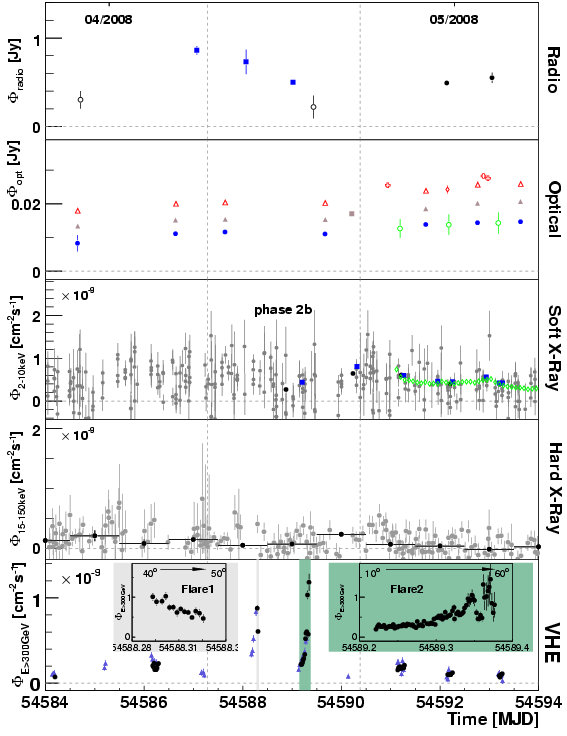 Figure 4: Mrk 421 light curves measured during the TeV flaring state in April/May 2008 (phase 2b). For details see caption and legends in Figure 1. Note, that the highest TeV flux around MJD 54590 was not accompanied by an increase in X-ray activity (compare with Figure 10). The continuous Suzaku/XIS soft X-ray monitoring (starting two days after the strong TeV flare) is shown, as well. The inserts in the lowest panel show the VERITAS TeV light curves in a 3min binning, covering the flaring time span indicated by the colored, vertical boxes. The flares were recorded under mostly large zenith angles (indicated by the arrows) with a correspondingly higher systematic error on the flux, see text for more details.
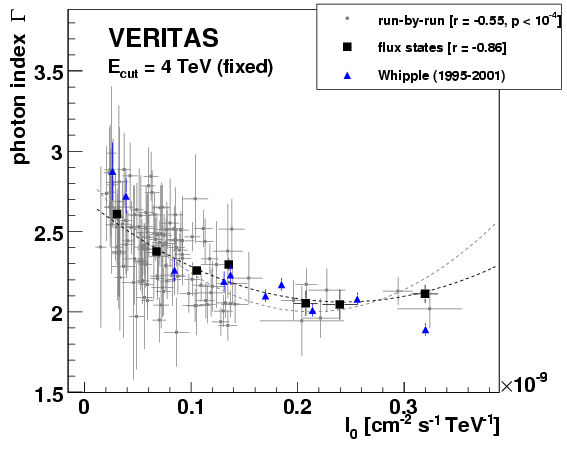 Figure 6: Photon index Γ versus flux normalization I0 (at 1TeV) obtained from a power-law fit with exponential cutoff (fixed to Ecut = 4TeV, statistical errors only). Each gray data point corresponds to a data run with a duration of 10 to 20min. The black points correspond to the values obtained from the fits to the spectra grouped according to their flux states (defined in Figure 5 and Table 2). Correlation coefficients r and the corresponding chance probabilities for the null hypothesis (no correlation) are given in the legend. Results obtained from earlier Whipple 10m observations (Krennrich et al. 2002) are shown for reference.